So I talked about “What is R in Trading” and why it is so important to understand. I hope I made clear that R lets you focus on and manage Risks by always setting a stop-loss order to take you out of a position automatically if things turn against you. Now, after writing that I was thinking: Where would I place my stop loss? How do I do it? And can I explain how I usually place my stop-loss orders? Interested in knowing how I do it? I will give it a shot and do my best to explain it to you.
Table of Contents
- When to place your stop loss
- How to place a stop loss in a trending market
- How to place a stop loss in a sideways market
- Finding good areas
- Should you move your stop loss once you are in a trade?
The most basic rule I use for placing a stop-loss order on my trades is this:
I want to be taken out of the trade automatically when the market shows me that my initial idea or reason for entering the trade, is no longer valid.
When to place your stop loss
I always place my stop-loss order together with my entry order. I usually enter on breaks or pullbacks using stop or limit orders. This means I will not be entering the trade immediately. Instead, I let to market trigger my trade.
But as I enter my entry order, I also enter an accompanying stop-loss order. This means that when my trade is triggered, I am immediately protected to the downside by an automatic stop order.
So, in my opinion, you should always place a stop order immediately. This gives peace of mind, as you know before you enter the trade, what you can lose at maximum.
How to place a stop loss in a trending market
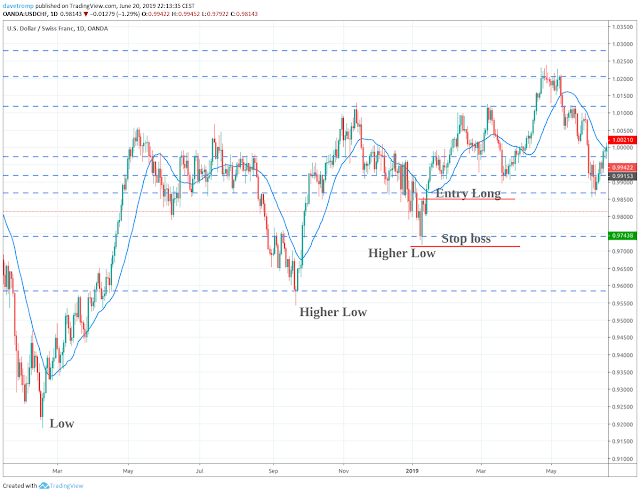
In a trending market, you could best place your stop-loss order below or above the previous swing low or swing high. The rationale behind this is that a market is trending as long as it is making higher highs and higher lows for an uptrend and lower lows and lower highs for a downtrend. Once price breaks this pattern our reason for the trade is no longer there.
Let us look at an example of a long trade on the USDCHF. On the below chart I have indicated where I might have placed an entry order to go long. There was an uptrend. Prices made higher lows. So as you entered the trade you could have and should have immediately placed a stop-loss order below the previous swing low.
The difference between your entry and your stop-loss is your maximum risk on that trade.
How to place a stop loss in a sideways market
In a sideways market, placing a stop loss is slightly different. However, the basic rule also still applies.
A market is trading sideways when prices move in a range. It should be a wide range, else I consider the market as untradable. If the market is in a tight range, then this is called a choppy market. I think it is called this way because traders get chopped to pieces in these conditions.
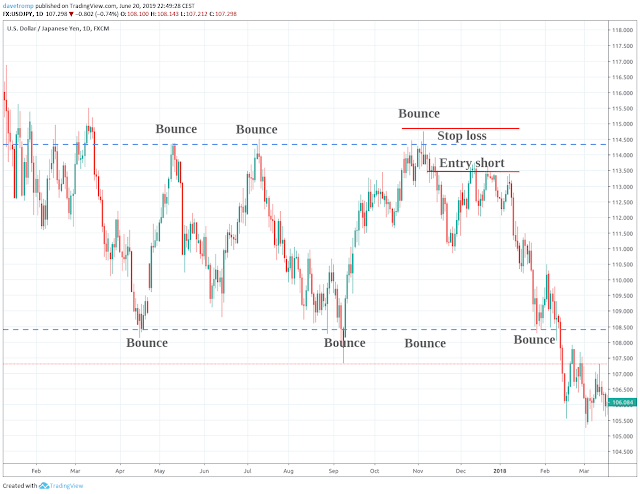
Anyway, let’s look at another example of how to place a stop loss when you are trading in a range-bound market. You need at least two bounces to confirm the range. Then as you enter (see below chart) you place your stop loss on the other side of the previous swing low or high. In this case, it was a swing high.
The idea is, that if prices move beyond that swing high, that we have broken out of the range. Therefore, we should not be trading this (now broken) range. Makes sense, right?
Finding good areas
When looking for areas to place my stop losses I am actually looking for layers of protection. If we place our stops too tight, we might get taken out of a trade, that could have been a winning trade.
Especially in the Forex markets, the Big Banks like to play games. They push prices in one direction, only to take it in the opposite direction after taking out many (mostly retail) traders out of their trades.
This is also known as stop hunting. And do not think it is your broker that is doing this to you. It is the big players in the markets, the big banks, who are responsible for all of this.
So you need to protect your trade from being taken out prematurely by your stop loss.
Here are two ways I do this:
- Only trade on the daily time frame or higher.
- Place your stop behind multiple areas that could indicate your trade is invalidated
So the big banks usually push prices around during banking/office hours. Especially, during the overlap of the London session and the New York session, volatility picks up and traders with tight stops get whipsawed. Trades made of the daily time frame are less affected by this intra-day volatility.
These are the layers of protection you can look out for:
- Horizontal support and resistance areas
- Diagonal support and resistance areas
- Fibonacci support and resistance areas
- Ichimoku based support and resistance areas, like the Ichimoku cloud.
- Moving average based support and resistance areas
- Candlestick patterns
Let’s look at each of these possible layers.
Horizontal support and resistance areas
These are the areas I use most. These are areas on the chart where price tends to reverse. So whenever price gets there it bounces and changes direction.I have already explained most of the concepts in this post.
Diagonal support and resistance areas
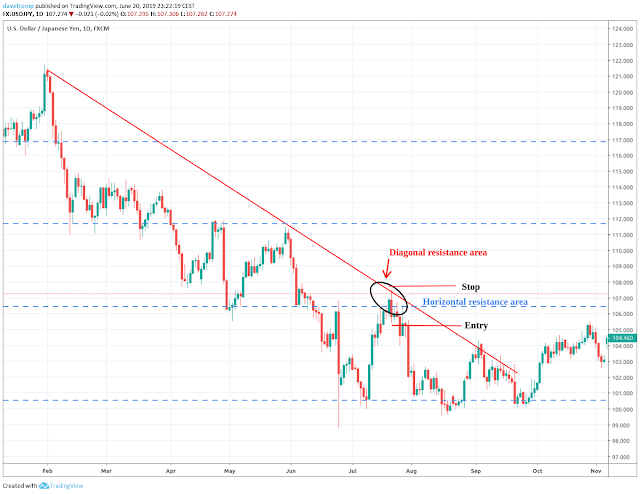
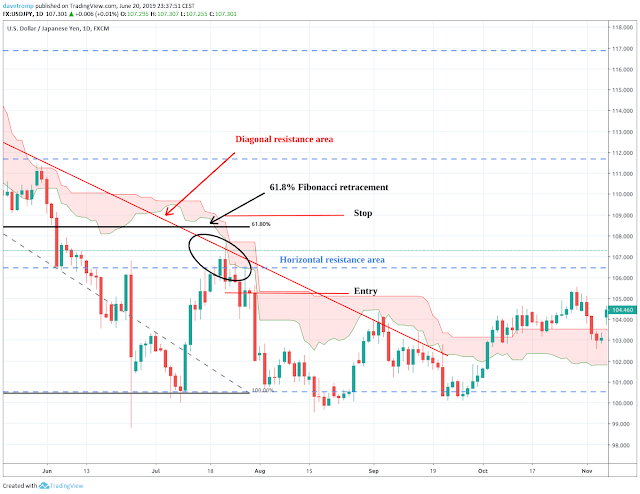
In a trending market price tends to bounces of trend lines. So placing your stop behind these trend lines could give some additional peace of mind. See what I mean by looking at the below chart.
Fibonacci support and resistance areas
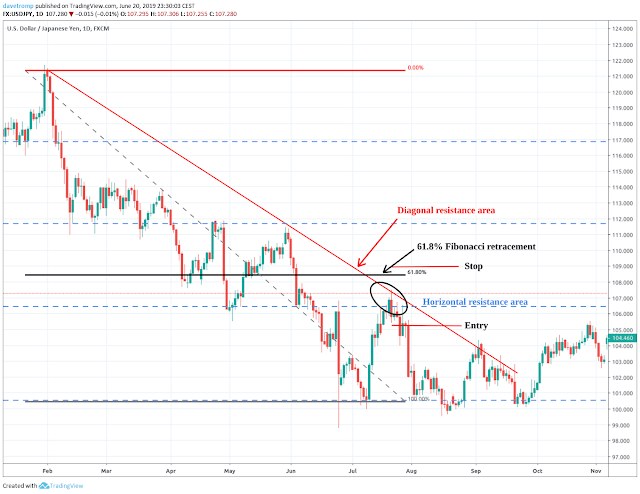
We could possibly find another layer if we draw the Fibonacci levels on the swing lower. As you can see, we could widen our stop a bit. And by doing so adding another technical layer of protection. The idea is that in trends prices have a tendency to retrace to the 61.8% Fibonacci level if it is a strong trend. If prices retrace more it could indicate a weakening of the trend or even a turnaround. In both cases, we would not want to be trading in the direction of that (weakening or broken) trend.
Ichimoku based support and resistance areas
If we add the Ichimoku cloud indicator to the chart, then we can see that the Kumo (Cloud) is forming another barrier for prices to push higher. This adds to our confidence that our stop loss placement is correct. Only if prices push above the Kumo, our trade will be invalidated. If you want to learn how to trade with the Ichimoku Cloud, I recommend this course.
Moving average based support and resistance areas
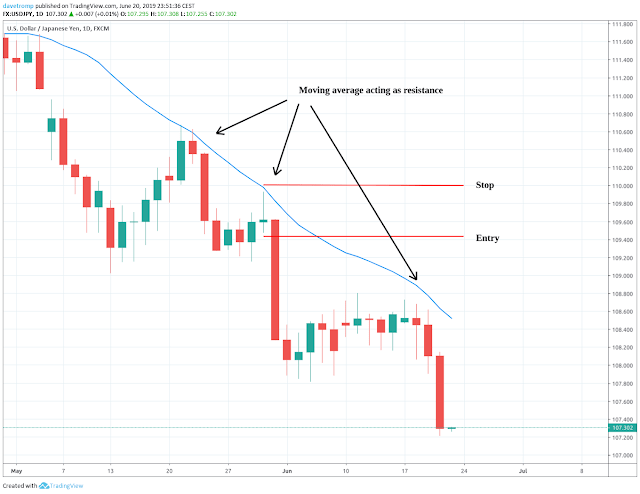
Often times a moving average (I use the 21 SMA) can act as dynamic support and resistance. Placing our stop behind the moving average will decrease the likeliness of the trade being stopped out by just a few pips or points just before it moves in your direction.
Candlestick patterns
In the same chart above you can also see the stop placement coincides with the top of the wick of the candle. Candlestick patterns like this show intraday turning points. And again if the price moves past this turning point of the previous day, it is likely that the trade has gone bad and that we should exit the position. These patterns are the bread and butter of how I trade. If you want to learn more about my method, then I recommend you first follow my free trading course on my blog here.
So I usually look for at least two layers to put my stop loss behind when trading of the daily time frame. The more layers confirm the same area the better.
Should you move your stop loss once you are in a trade?
No, you should not need to move the stop loss once your position is open. At least, you should never widen the stop loss on your trade. If you want, you can tighten the stop loss as your trade moves into profit, eventually locking in some of these profits.
If you just started to learn how to trade, then I suggest you simply place your stop and either be taken out of the trade by your stop-loss order or hopefully by your take profit order :-).
In any case, know that you will get stopped out. Just look at my win rate. It is about 40%. This means that I get stopped out of 60% of my trades. I see this as the cost of doing business. After reading this post I hope that you will no longer, or at least less often, get whipsawed out of your trades and out of your money.


