In this article, I will tell you about the possible tools you have at your disposal for trading. Whether you are building a fence or building a trading strategy, you need tools to get the work done. In the previous articles, we already looked at the question of why, how, what, and where to trade. Now it is time to get some tools and set up an infrastructure for trading. We need three types of tools.
We need tools for:
- data
- analysis
- trade execution and management
Table of Contents
Data: getting it, preparing it, and saving it
 |
| Data: get it, prepare it, save it. |
The first thing we need is data, that we can use for our analysis, which in turn will lead to the execution of our trades. Not only do we need to know where to get the data, but we often also need/want to transform the data into a (more) usable form. And once we have the data and take the effort to transform it somehow, we need to keep/store the data and the results of our analysis.
Forms of data
Data comes in many forms, shapes, and sizes. Mostly we will be looking for:
- charts
- historical price data (time series)
- fundamental data
- news
So where to get data?
Charts
Price charts are most probably offered by your broker. If you trade FX and CFDs then your broker will most likely offer the MetaTrader platform or maybe the cTrader platform. Both of these offer good charting in my opinion.
If you want to get your charting from another source than your broker, then you have a few options. A favorite option is TradingView. This is a free online charting platform.
If you trade or invest in stocks and ETFs based on the daily closing prices, then most online finance sites like Google Finance, Yahoo Finance, Blomberg, etc. offer charts that will help for getting an overview of the market. These charts are not good enough to do advanced chart analysis.
Another site that you can use for advanced chart analysis is Investing.com, but all things considered, I think that TradingView is the best charting option for any market.
Historical Price Data
All charts are nothing more than visual representations of prices over time, also called price time series. This is interesting data to have as it will allow us to analyze prices in a different way, than just visually.
It will also enable the automation of backtesting. This will speed up our trading analysis process. Always mind data errors in the freely available data you find online. Especially daily highs and lows can be way off. Therefore it is most safe to only use closing prices from free online sources.
Manual data retrieval
You can download data from financial websites and load them into a spreadsheet for analysis. I use the following sources to get historical price data manually:
 |
| Getting data on Investing.com |
- Yahoo
Just look up a security and go to the “Historical Prices” page: http://finance.yahoo.com/q/hp?s=AAPL+Historical+Prices
You can select daily, weekly, monthly, and yearly data. Yahoo Finance will give you volume, open, high, low, and close prices plus adjusted closing prices. Adjusted closing prices are historical prices that have been adjusted for events like stock splits. For instance, if a stock price was 200 USD and was split to become 2 times 100 USD all historical prices before this event would be recalculated by dividing it by 2. This way it is possible to make a correct comparison of the prices over time. - Investing
Investing offers more or less the same kind of data as Yahoo Finance, but in addition, it offers historical data on currencies, metals, and cryptocurrencies in daily weekly, and monthly timeframes. See https://www.investing.com/currencies/eur-usd-historical-data. - StooqAt www.stooq.com you can download price data for almost any security there is. The site is based in Poland. It is set up in Polish, but the main navigation will translate to English if your browser/OS is set to English. I once contacted their customer support to ask some questions about the data they offer and I got a prompt reply in English. They offer download options for daily, weekly, monthly, quarterly, and yearly data on the historical data page much like Yahoo and Investing. For example http://stooq.com/q/d/?s=eurusd
- Dukascopy
Dukascopy is a Swiss broker. They offer free downloads of complete historical forex price data down to ticks. You do need to register to download. You can find the download options at www.dukascopy.com –> market info –> historical data feed.
Automated data retrieval
Getting the data manually can become a problem if you want to test a strategy on many different securities. Luckily, several services allow us to easily automate the retrieval of data.
- InvestPy
InvestPy is a Python library that will let you retrieve historical price data from Investing.com. See https://github.com/alvarob96/investpy/ - AlphaVantage
AlphaVantage.co is a service provider that offers access to real-time and historical stock, FX, and cryptocurrency price data. You need to authenticate via the API key. You can sign up for free and get an API key at https://www.alphavantage.co/ - Pandas DataReader
I use Python with the pandas library to do many of my analysis and data handling. Pandas has a (now) separate library that allows easy access to free data from Yahoo and others. Check out https://github.com/pydata/pandas-datareader - Oanda API
The broker Oanda has a rest-API. Among other things, it allows for accessing historical price data up to 5000 data points. If you have a practice account you can access the API and retrieve all FX CFD data this way (please note that US customers do not have access to CFDs). See http://developer.oanda.com/
How to prepare historical price data?
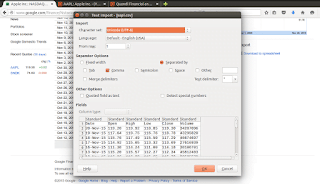
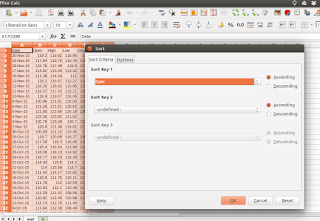
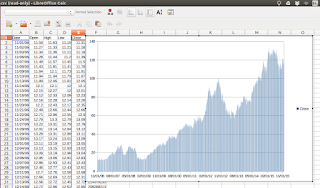
Sometimes the data you get will contain errors. So the first thing you want to do after you get the data is to plot it, inspect it visually, and adjust/remove any obvious outliers. You can do this by simply reading the data into a spreadsheet and making a graph. I do this in LibreOffice Calc or in Python, but you can do this in any software you like, such as Excel, for instance.
How to save data, so you can handle it?
I usually just save the data as a CSV file (comma-separated file), but you can also build a securities database in an SQL database. This way it is easy to reuse the data. You can retrieve and clean the data once and then use it over and over again. Also over time, you will be able to build up a database of data that goes back in time. I like CSV files as they are easy to use and understand. They can be read into a spreadsheet and a spreadsheet can be saved as a CSV file.
 |
| Python with the pandas library. My tool of choice. |
Also with the Python Pandas library, it is very simple to read a CSV file into a data frame using:
df = pandas.read_csv(“file.csv”)
The data frame is more or less like a spreadsheet but can be manipulated using a few simple lines of Python code. The result can then be saved to a CSV file like this:
df.to_csv(“newfile.csv”)
Then this file can be opened again in LibreOffice Calc or in a text/code editor. Pandas also has read and write functions for Excel, SQL, JSON, and others. For me, the CSV format has been the most efficient to use. For large sets of data databases, the HDF5 datastore format might be more convenient.
More info on the read and write options in Pandas can be found here: http://pandas.pydata.org/pandas-docs/stable/io.html
Fundamental Data
TradingView and Investing offer screeners that allow you to screen stocks by fundamental data like P/E ratios, etc.
Two other interesting sources, that allow for programmatic access to data, including fundamental data are also mentioned above:
- Quandl.com
- Pandas DataReader
News
I do not trade the news, but I do mind big news events as they may cause higher-than-normal volatility. Most trading platforms incorporate some sort of news feed. I use TradingView’s platform and this platform has a nice feature that plots future and past news events on the price charts. This way it is easy to see which events tend to move the markets.
A similar feature is available on the charts of Investing. Investing also offers a news feed and alerts of breaking news events and scheduled events like announcements by central banks, etc.
Analysis
 |
| Analysis |
So you got all the data, and cleaned it up, now what? Well, have fun with it! With me, it all starts with simply looking at the data. Our minds are made to look for patterns in randomness. So I use this first, I use my head.
The next step is to try to translate the pattern I think, I have found, into a few simple rules. For example, a rule can be: “If today’s closing price is more than 2% higher than yesterday’s close price, then the next day will be a down day, meaning I will sell short at the next day open and buyback just before the close.”.
I write down the rules and then I manually backtest the rules using software like TradingView if possible. I then model the rule set in a spreadsheet. The following step is to write a backtest in Python. This will allow me to do the testing on more different data samples more quickly, than when I would use only spreadsheets.
Backtesting with Python also allows for more complicated strategies to be backtested and it is the first step to automated execution of the strategy.
Execution
 |
| Execution of your trade |
The execution of trades can be done in basically three ways:
- Through trading platforms
This is straightforward enough. You just enter your trades in your broker’s platforms. - Through online trading APIs
Many brokers offer access via trading APIs. There are different kinds of APIs, but the most commonly used are rest APIs and the FIX protocol API. Restful APIs are APIs that are typically used on the web to have web applications interact with each other. The FIX Protocol is a protocol used mainly by professionals to interact with financial platforms like exchanges, brokers, and liquidity providers. - Through local API to the trading platform
Some platforms allow you to hook up Excel to the platform, so you can get data into Excel from the trading platform and generate trading signals that can then be executed via the trading platform. This means you will have to have everything on your computer or on a server. Some platforms also allow for programmatic access. For instance, cTrader has cAlgo that allows you to program your strategies in cSharp and Interactive Brokers has a Java-based API.
I use Python wrappers to access the Oanda Rest API and if I would want to access the Interactive Brokers trading platform Java-based API I could use ibpy. This highly simplifies accessing the APIs and you do not have to reinvent the wheel.
I also have used Darwinex ZeroMQ Connector to access Metatrader4 from Python.
Github is your friend here:
https://github.com/blampe/IbPy
https://github.com/hootnot/oanda-api-v20
https://github.com/darwinex/dwx-zeromq-connector
I know I only briefly touched on many different things and I referenced a lot of sources. My intention is now to get you familiarized with the tools I use and to get you to research all the tools I reference.
Updated: 2019


Comments are closed.