In this post, I will give an overview of commonly used trading approaches. This is the second article in a series of articles I am writing to help anyone get started trading. If you haven’t read my first article in this series yet, then read that one first at:
Why Trade? – the Question you need to Ask before you Start
I think it is important that you have a basic understanding of the different ways of trading. It will help build your understanding of how the markets and the participants work. And it will give you trading and investing avenues to explore as well. I will discuss the following:
Table of Contents
- Fundamental Trading
- Technical Trading
- Discretionary Trading
- Rule-Based Trading
- Automated Trading
- Algorithmic Trading
- Quantitative Trading
- High-Frequency Trading
Fundamental Trading
 |
| Trading based on Fundamentals |
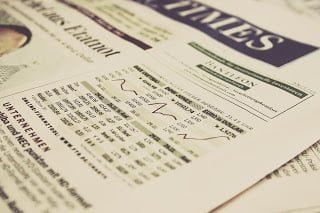
Trading based on fundamentals is what is mostly discussed in the financial news shows. It is also what most people think of when they think of trading or investing. It is about things like company earnings figures affecting a certain stock or interest rate decision influencing currency rates. The idea is that information concerning the real economy or performance of a company or country will be reflected in the price of securities. This makes sense and there are many successful investors and traders that base their actions on fundamentals.
An important question is:
When will fundamental information be reflected in the price?
Sometimes information is already reflected in the price, or “priced in” at the time information is released. This means the price will not move or even move in the opposite direction of what the information implies. This is why some people prefer to look only at price itself to base decisions on, which is technical trading.
Technical Trading
Technical Trading is trading based on price information (and sometimes volumes as well). It is built on the idea that all information that could influence a price is already reflected in the price, or priced in. The idea is also that all market participants have more or less the same information at the same time. This is called the efficient market hypothesis. Technical traders usually look at price charts and use technical analysis to come to their decisions on whether to buy or sell a security.
Indicator based Technical Trading
 |
| Indicator based Trading |
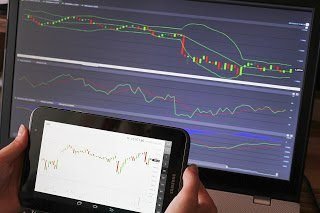
There are many books written on the topic of technical analysis and many of them involve the use of indicators. Indicators are statistical derivatives of the price (series). Indicators give a different perspective on past prices and as such, they can be used to indicate what is likely to happen to prices next. So it is always a statistical value indicating some probability of a future event to happen.
There are still many people looking for something traders call the holy grail. They believe that there is a magic combination of indicators that will show them the future price with almost 100% probability. They just haven’t found the right combination yet. Well, let me tell you this: if there is a holy grail in trading, then this isn’t it.
Honestly speaking, I do not believe that there is a holy grail, as this implies that there is one specific way of trading that will make anyone money. I believe that anyone can and should find his or her way to trade profitably. So I think indicators are helpful, but only if they are part of an integral look at the markets, not if they are used to signal buy- or sell-opportunities in isolation.
Price Action based Technical Trading
 |
| Price Action Trading |
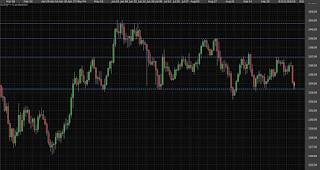
Another way of doing technical analysis is to look at the price itself and understand the order flow that causes the price movement. This is known as price action trading.
Simply by looking at what levels price accelerates, stalls, or reverses you can figure out at what price level there were large groups of buy or sell orders in the market. These grouped orders create what is seen as price zones to which price reacts over and over again each time the price reaches the zone. These zones offer support and resistance.
Price action analysis can also look at the price in different representations. This is done by charting price for instance in the form of bars and candlesticks. These kinds of charts represent 4 prices per data point in one view, namely the open price, the high price, the low price and the closing price printed during each period. And then there are more things to analyze, that can give a better understanding of what is about to happen in the market. By this, I mean things like market structure, price formations, (repetitive) price behavior, etc..
Discretionary Trading
 |
| Using Your Brain to Trade |
This is only the tip of the iceberg of possibilities. I use all of the above-explained ways of trading, but not only these. I look at a set of different fundamental and technical information to figure out what price will most likely do soon. I identify levels, that if broken, indicate that my assumptions of the future price movements were wrong and as a consequence, I get out of the market even at a loss.
I have no hard rules, but I do have guidelines, methods, and processes by which I come to decisions. So I do not trade mechanically, but discretionary. I think about my trades and take a holistic view. I do have a routine, a process by which I analyze the markets and enter and exit trades.
Rule-Based Trading
On the other side of the spectrum of How to Trade, which is opposite to discretionary trading, is:
- Rule-Based Trading
Rule-based trading is best described as being 100% mechanical in analyses of the markets and execution of trades. This means that all trades are entered and exited based on strict predefined rules.
Systems traded this way need to be thoroughly back-tested first by the person who will finally execute the system on a live account. This way the system can be followed rigorously without a doubt. Rule-based trading systems try to take emotions out of the equation when trading with real money.
I have found it very difficult to rigorously follow system rules, even after manually backtesting systems over large sets of data. This is a personal preference and it is why I prefer discretionary trading over 100% rule-based trading, but this may change as I develop as a trader.
Automated Trading
A way to ensure rigorous execution of a (rule-based) trading system is by (partial) automation of the analysis and/or the execution.
One way of partially automating the execution of trades is by setting predefined exit levels and then employing a set-and-forget trading regime. This means that at the time of placing the entry order, you will place two other orders that will be executed at certain price levels and get you out of the trade either at a loss or at a profit. Once the analysis is done and the orders are entered with your broker, you just go on with other important things in life, like working, cooking, etc.
In addition to this, you can automate the generation of the entry signals, so you will be sent an email or SMS whenever a trade matches your predefined entry rules. This can be done with trading platforms like for instance MT4 or TradingView.
Algorithmic Trading
 |
| Algorithmic Trading |
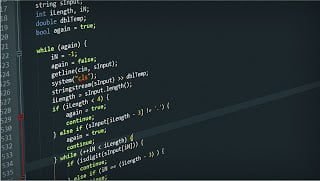
Algorithmic Trading is nothing more than fully automated trading of a rule-based trading system including analysis, entering and exiting trades.
An algorithm is nothing more than a recipe, or a step-by-step instruction that can be executed by a computer. Usually, trading is called algorithmic trading if the automated rule-based analysis is complex and implements stuff like machine learning, regression, optimization, Bayes rules, and other fancy statistical methods.
All I can say is:
- Don’t be intimidated by it.
If you can cook, you can come up with an algorithm. Just be creative and be sure you still understand what the algorithm does. Profitability and complexity do not necessarily go hand in hand here.
Quantitative Trading
Quantitative analysis is a form of technical analysis that looks at quantitatively defined events to find a “proven” or “tested” probability trading forward, also referred to as Quantitative Edge.
You can use an event profiler to find events that have an on-average high probability of being skewed to one side. Usually, there is a natural underlying market tendency that is the basis that leads to an explanation of this quantitative edge.
For example, an event is defined as:
“If today’s closing price is 2% higher than the last trading day’s closing price we mark an event.”
We can then mark all the events that happened over the, let’s say, past 10 years for a group of securities. Next, we can put them all on top of each other and graph the average price behavior around the event. This will tell us the on-average effect of the event on the markets we tested it for.
So if we look at price movement before and after each event over the past 10 years and record the average of these movements, we can learn if this kind of event leads for instance mostly to mean reversion or breakout patterns after the fact. In other words:
- Will price mostly move lower after a 2% spike higher, or will it continue to move higher?
- And for how long?
- And how far?
Once we have found an event-market-tendency combination, we can hypothesize and backtest the hypothesis. An example of such a hypothesis is:
“If the closing price of the S&P500 is more than 2% higher than the opening price, then the next day price will again close higher.”
If you do not understand what I just tried to explain, then don’t worry. I just want you to know about this way of trading / looking at the markets.
High-Frequency Trading
 |
| High Frequency Trading in action at co-location |
HFT or High-Frequency Trading is trading at speeds that only computers can execute.
An HFT system can buy and sell a contract 2000 times per second (or more). The idea is to make tiny profits with very limited risk/exposure to the market. And then do this as many times as possible.
HFT is all about:
- Trading technology
- Network latency
- Working the order book
- Making use of deficiencies in exchanges and trading infrastructure
- …
HFT firms like to point out that they have provided tremendous liquidity to markets and that they smooth out differences between related securities and exchanges enabling (retail) traders to always be able to trade at the best price available.
Theoretically, this is true, but the reality is that these firms exist to make money any way they can and they will use all the technological advantages they have to do so, even if this will mean possible unethical handling, just like floor traders would sometimes misuse their unique position in the trading process.
I am not saying that HFT firms are all evil, but they are run by human beings. And they may cross the line of ethical behavior just like the rest of us. The additional issue with HFT is, that it all happens on a very large scale and that most people and regulators have difficulty following what is going on.
There are probably more ways of looking at trading, but these are the angles I use to look at the subject. By no means, this is the end all be all of trading and investing info. This is just my view on the matter.


