


This document is a way to bring together all the backtesting and forward testing and trading that I have done for the past few years and to come up with one consistent plan that I will then backtest thoroughly.
The idea
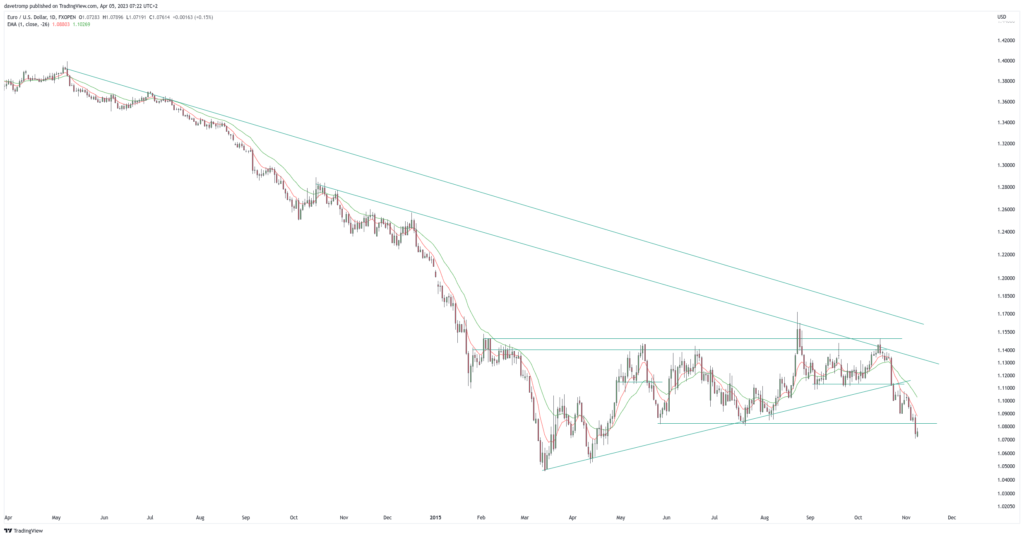
The idea is to test different market structure confluences on a daily time frame only. If this strategy is viable it should be possible to trade this by only looking at the daily TF for entering.
I will use candlestick patterns at areas of value as entry signals.
Trade management will be either set and forget with a 1:1 RR, and 1:2RR, or I will manage the trades by reducing the SL 1R for every 1R reached.
Goal
The goal is to develop a strategy that I can trade at a prop firm and in my own account next to my day job. We need to take the prop firms’ risk parameters into account. So a high performance ratio is more important than a high return.
💡 Steady wins the race!
1:1
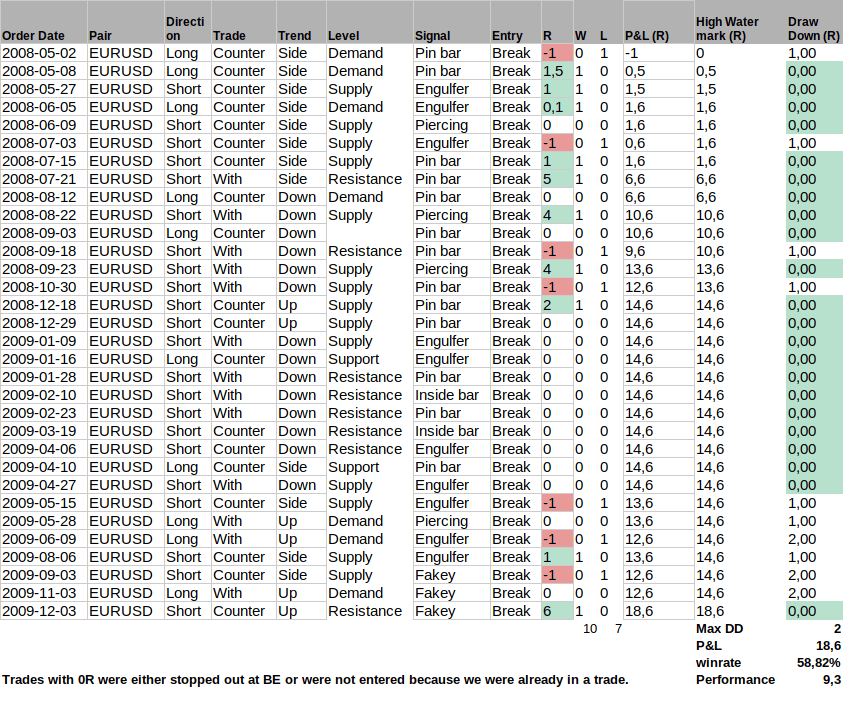
A small backtest of 1,5 years of data on the EURUSD resulted in 32 trades. I tested the following entry and exit scenarios.
- entry at break
- tp at fib extension level 2, or 2.272
- sl at fib extension level 0, or 0.236
This resulted in 4 combinations of entry and exit levels with RR ranging from 1:1 to 1.5:1.
It showed the highest returns for the version with the tighter stop at the 0.236 retrace level and the highest performance ratio for the 1:1 RR.
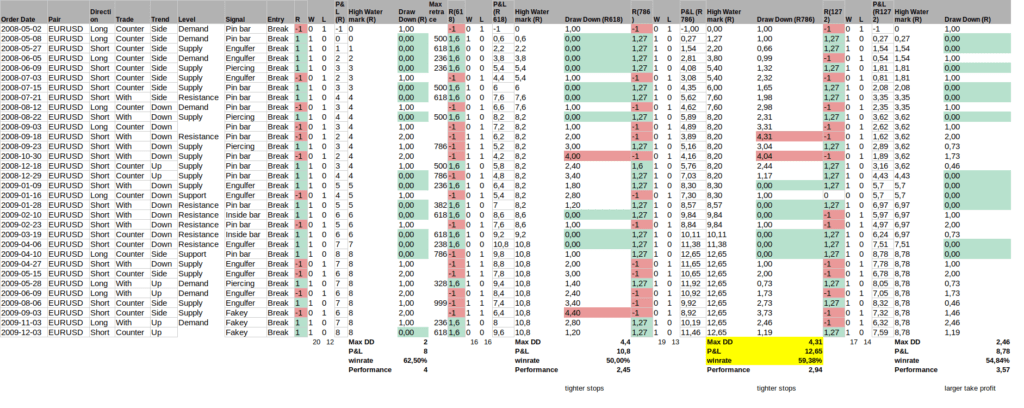
As areas of value, I used S&R Lines, supply and demand Zones, and EMAs.
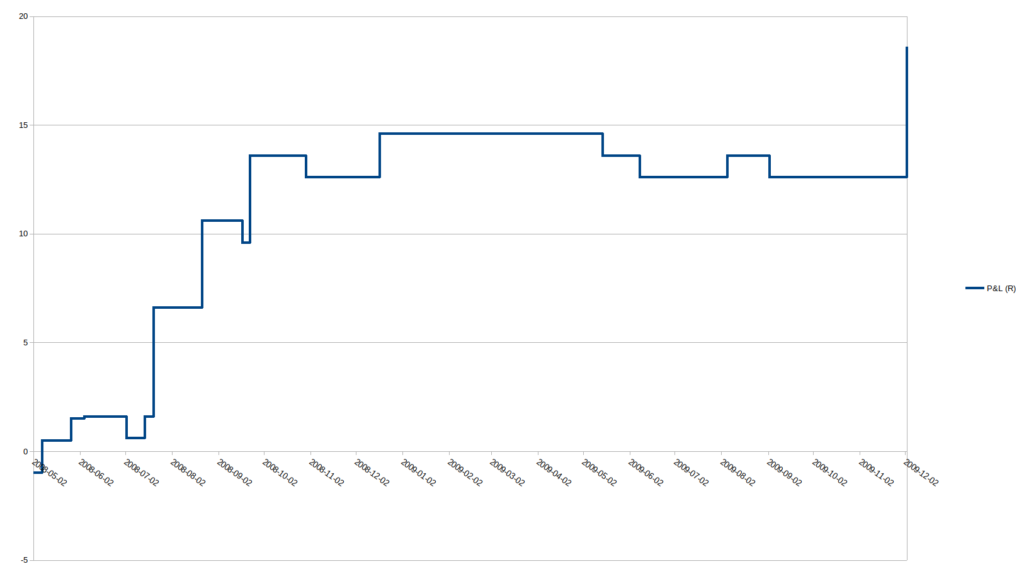
Profits run
I also looked at letting the profits run by simply moving the SL to BE once the price touched 1R and moving it to fib 2 once the price hits 2R etc. This will result in large returns in trending and BE trades in ranging markets. Also, it will keep me in trades longer. And while I am in a trade, I will not enter any new trades. So we will probably have fewer trades.
My intuition says that the 1:1 RR will result in consistent profits while letting profits run will result in more profit, but only in trends. So if you miss a trend, you might miss the profits. So for the profits-run strategy, you need a very consistent execution.
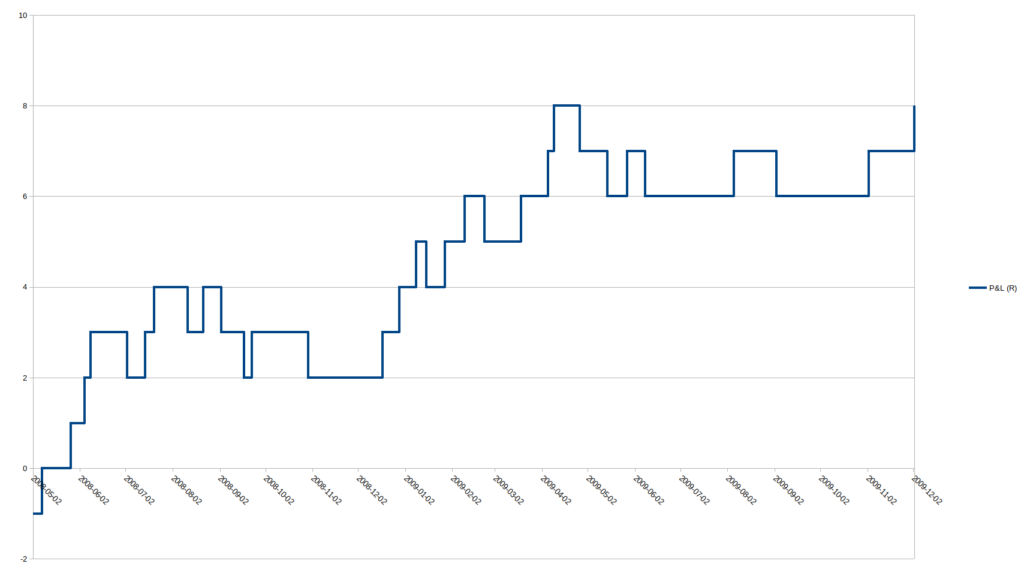
I went ahead and adjusted the trades of the 1:1R strategy to profits run targets. Here is the result.
Combined
If we would allocate half of our position to each trade management strategy, then this is the resulting R curve.
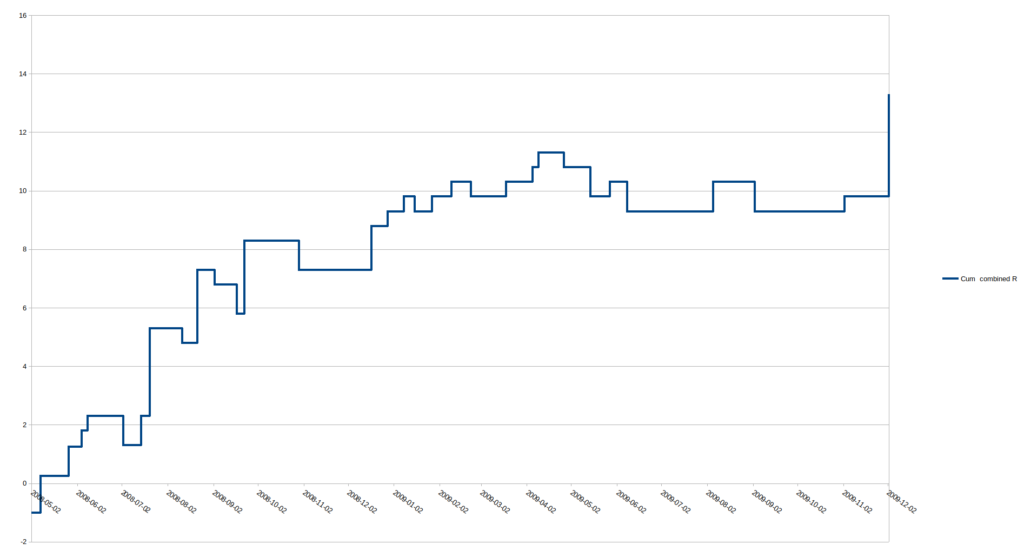
I think that combining the two trade management styles is a good idea.
In addition, I think I should place an extended TP order right before the next Area of Value because this is where the price will most likely reverse.
1:2 Supply and demand zones test
Since 2021 I have added Supply and Demand zones to my method of trading. I have also backtested the use of these zones.
See this backtest of about 100 trades in about 1 year across different pairs.
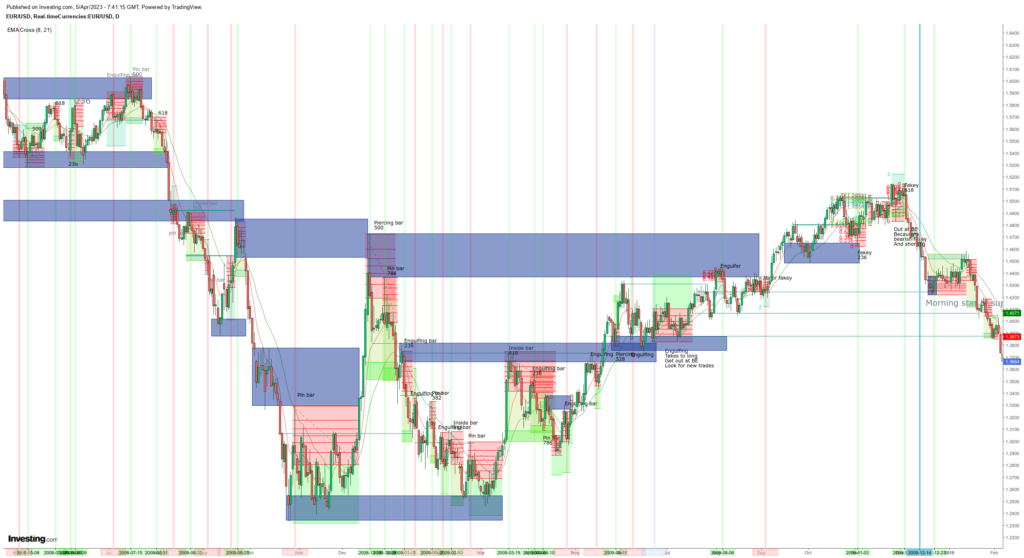
Forward test
I have been trading a small account for a couple of years now using different approaches on an end-of-day basis.
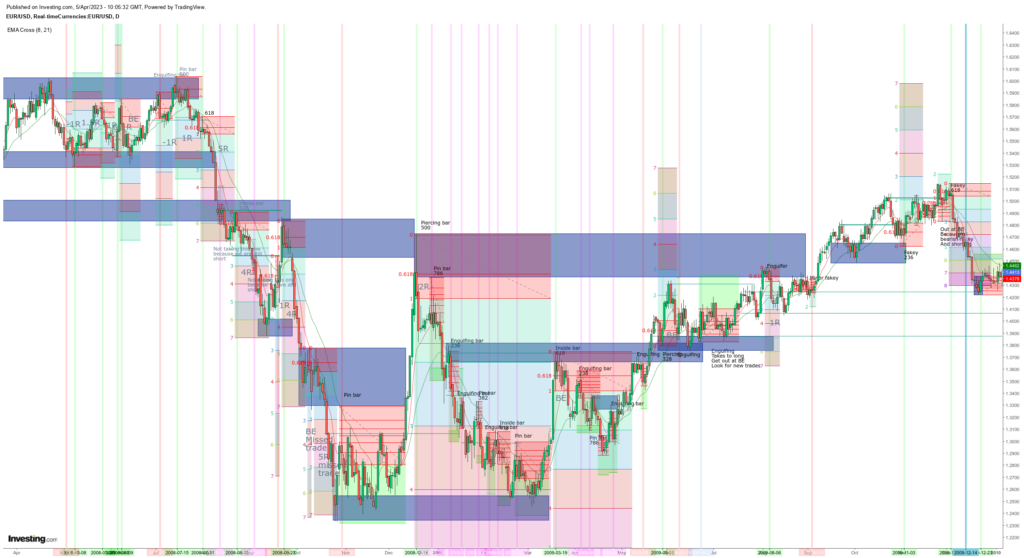
Here is my trading log.
As you can see there are many different styles of market structure trading finally being combined with Supply and Demand trading.
Currently, I also integrate SMC in my analyses, although I have not yet backtested them.
Backtest
OK, so what method will I backtest?
The backtest will be implemented with three positions on each trade signal. One will have a fixed TP of 1:1 RR and one will have a fixed TP of 1:2 RR. The last position will be managed by moving the SL by 1R for each 1R reached.
The backtest will record the following trade information:
- Order date
- Entry date
- Exit date
- Pair
- Direction (Long, Short)
- Trade type (Counter trend, With trend)
- Trend type (Up, Down, Side)
- Level (Support, Resistance, Trend line, 8 EMA, 21, EMA)
- Signal (Candlestick pattern)
- Entry method (Break, Retrace)
- Trade management method (1:1, 1:2, profits run, scale in, hedging)
Max retrace- Chart screenshot(s)
- Comments
- Why did I enter the trade?
- How did I feel before and during the trade?
- What would I do differently next time?
The backtest will need to record the entry and exit date so that I can figure out a possible time-based exit. For example: if all trades held for longer than 10 trading days are losers, I might implement a rule to cut off trade after 10 trading days. Take the loss and move on.
Let’s keep track of how far the prices of winning trades retrace aka the max retrace. This could allow optimizing the results by either entering on a certain retrace level or by placing the SL on a certain retrace level, thus reducing risk and enlarging the RR.
This will slow down the backtesting process to much and it can lead to over-optimizing.
Trade Setups
💡 Map out the Market structure and Areas of value.
I will look for trades on the following Forex pairs:
- EURUSD
- GBPUSD
- USDCAD
- USDJPY
- USDCHF
- AUDUSD
- NZDUSD
- XAUUSD
- XAGUSD
I will do a multi-time-frame analysis on the M, W, and D.
I will map out Areas of value using:
- Trend lines
- S&R Lines/Zones
- 8 and 21 EMAs
- Supply and demand zones
I will analyze Market Structure to understand how price reaches Areas of Value. I will look at:
- Highs and lows
- Impulsive/corrective nature
- Chart patterns
I will look for confluences in three parts:
- Trend
- Level
- Signal
💡 Trade reversals or break and retest continuations at areas of value.
Trend
Look at weekly and daily TF to see if we have a strong move and in what direction, or that the market is ranging.
Level
See if we are approaching an area of value.
Use market structure to judge the approach of a level and judge if the level is likely to either hold for reversal or break for a retest and continuation.
I will look at:
- 8 and 21 EMA
- S&R lines/zones
- Supply and demand zones
- Trend lines
Signal
💡 Enter at breaks of structure and/or based on candlestick patterns at areas of value.
Structures that can see breaks areas of value are:
- Trend lines
- S&R lines/zones
- Supply and demand zones
Candlestick patterns indicating a reversal or retest continuation at areas of value are:
- Pin bars
- Engulfing bars
- Piercing bars
- Tweezer bars
- Inside bars
- Inside bar fake outs
- Morning and Evening star patterns
- Indecision candle
I use the conventional candlestick patterns, with some twists to the pin bar and piercing bar pattern.
Pin bars
Pin bars need to have the body in the upper or lower 38.2% of the candle range in order to be valid.
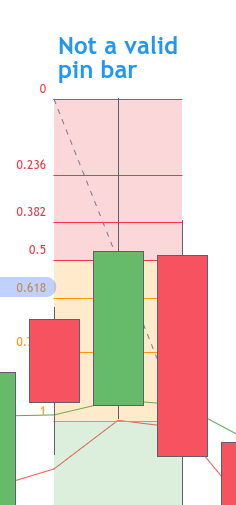
This is a valid pin bar as the body is below the 61.8% level of the reversed fib, which means its body is in the lower 38.2% range of the candle range.
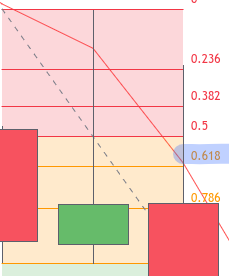
Piercing bars
My definition of a piercing bar is a bar that is pushing at least 61.8% into the previous range. This can be bullish or bearish.
Basically, we wanna see rejection. So an upper wick help in the below example.
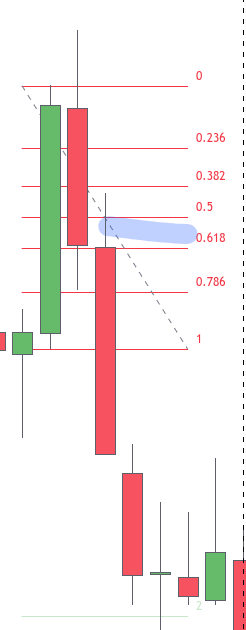
Entry
I enter using a stop order at the break of the high or low of the previous candle or candlestick pattern. I can also enter at the 50% retracement level of the pattern to get a better entry with a 1:2 RR.
Stop
Every entry order has a stop loss order at the other end of the candlestick pattern
Take profit
See trade management.
Trade management
Two orders
Initially, I will put on three equal-sized orders, each at 1/3 the total risk I want to take.
The first order will be set and forget with a RR of 1:1 entering at break.
The second order will be set and forget with a RR of 1:2 entering at a 50% retrace.
The third order will be entered at break and managed in order to let the profits run. I will use the fib tool to manage the trailing stop. If the price touched fib level two, then the first order will be closed with a 1R profit and the second order will have the SL moved to BE. if the price continues and touches fib level 3, then I will move the SL of the remaining order to fib level 2.
Scaling in the managed trade
If the managed order is still open and I see a new trade setup in the same direction, then I can trade that setup with a 1:1 RR order if that order is not running yet. I can also enter a new 1:2 RR order entering at retrace if this order is not running.
Hedging the managed trade
If the managed order is still open and I see a new trade setup in the opposite direction, then I can trade that setup with a 1:1 RR and a 1:2 RR order.
At any time at any pair I can have open max 3 orders;
- one 1:1 RR order
- one 1:2 RR order
- one profits run order
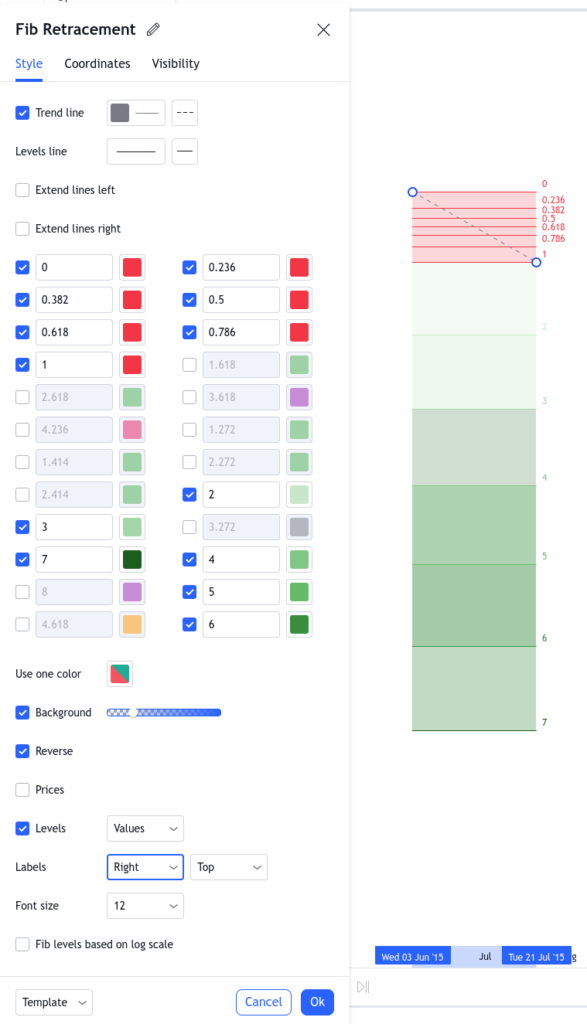
I use the Fibonacci tool to record the trades and find the levels. Here are the settings.
Backtest session recap
Backtesting is like simulating and practicing live trading. Therefore like in real trading, we do weekly or monthly recaps. I think it will be helpful to do session recaps.