
Home »
Every trader needs to have a trading plan. Below is my trading plan. You can use it as a reference to create your own.
Below is an out dated version of my trading plan. Use it as inspiration for writing your own.
Mindset
What is your trading goal?
Be a consistently profitable trader using the strategy detailed below trading my own and prop firm accounts.
How will you achieve this goal?
Every Sunday and workday at the New York close I will check for setups and place orders on my account. This will be at 23h00 CET. I will also document all trades in my trading journal. By 24h00 I must be done and go to bed. During the day I will only check my trades or charts at 7h00, 11h00, 15h00, and 19h00 for 5 minutes max, and then again at 23h00 for the daily New York close.
I will also practice the trading strategy on Tradingview by backtesting all pairs from 5 – 10 years back or at least 100 trades per pair. This is in order to become more proficient in spotting my setups and to reinforce confidence in the strategy.
What are your biggest weaknesses?
Fiddling with trades and overtrading. In general not being consistent enough. Stopping after a losing streak. Trading recklessly after winning streak.
How will you overcome your weaknesses?
- I will limit my exposure to the market to the hours between 23h00 and 24h00 CET.
- I will only trade the daily TF.
- I will trade low-risk position size (1 – 2 % on my personal account, less on prop account).
- I will only take trades that have a minimum of 1:2 RR potential.
- I will consider every trade as money lost.
- I will initially apply set-and-forget trading, but I will manage part of the trade on the 4hr, and daily TF.
- I will set limit and stop entry orders with a stop loss and take profit order
- I will remove limit orders that were invalidated.
What is your daily trading routine?
At 23h00 CET I will:
- I will map out the market structure and areas of value.
- Then I will look for setups.
- I will remove invalidated entry orders.
- I will place new trades
- I will record all actions in the trading journal.
Strategy
Objectives
Target to make 2 to 5% per month trading end of the day on a select group of assets.
Context
This works best when markets are moving reasonably predictably using technical analysis. This means I might want to be careful when trading in known slow months, like December, July, and August, or during big events like wars, elections, and market crashes.
Filters
Which currency pairs will I trade?
I will look for trades on the following Forex pairs:
- EURUSD
- GBPUSD
- USDCAD
- USDJPY
- USDCHF
- AUDUSD
- NZDUSD
- EURGBP
What time frames will I trade?
I will do a multi-time-frame analysis on the M, W, and D.
I will look at 4hr TF only to get a better picture of the price action. I will not trade on setups on the 4hr TF that form during the day.
Setup
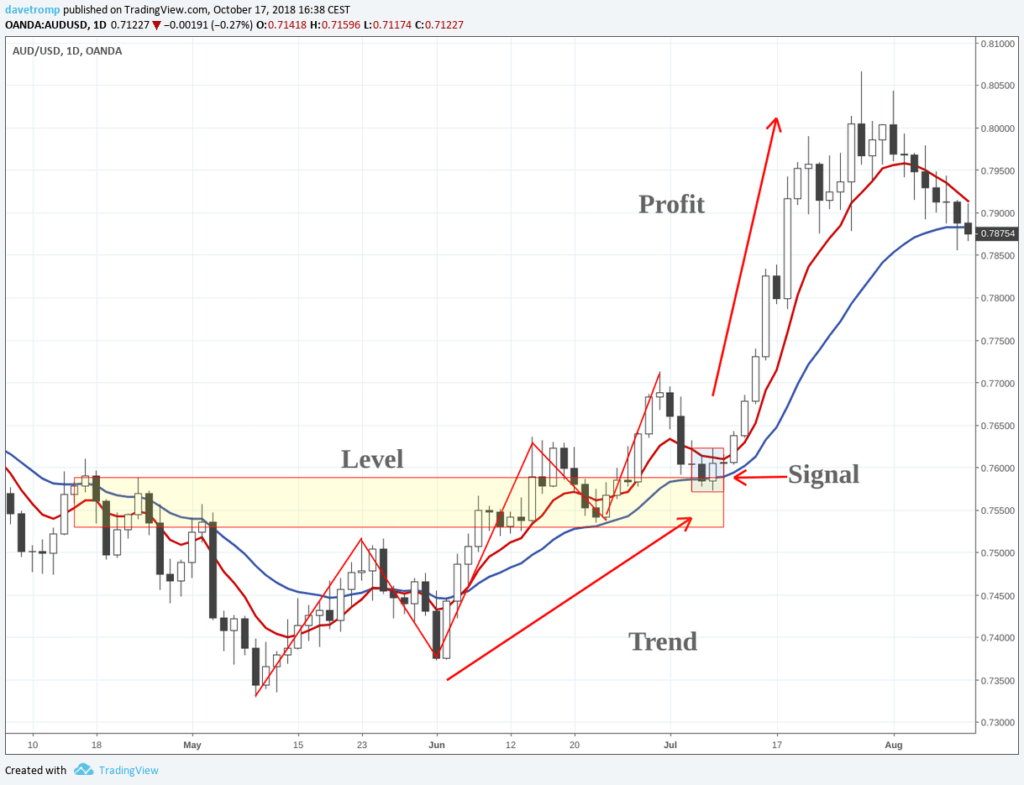
💡 Trade reversals or break and retest continuations at areas of value.
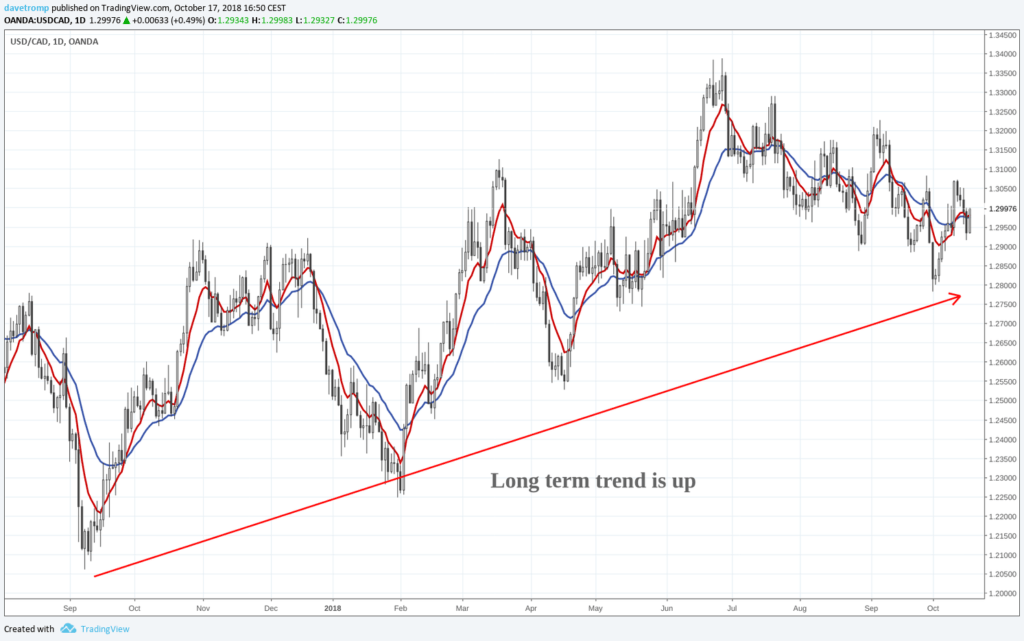
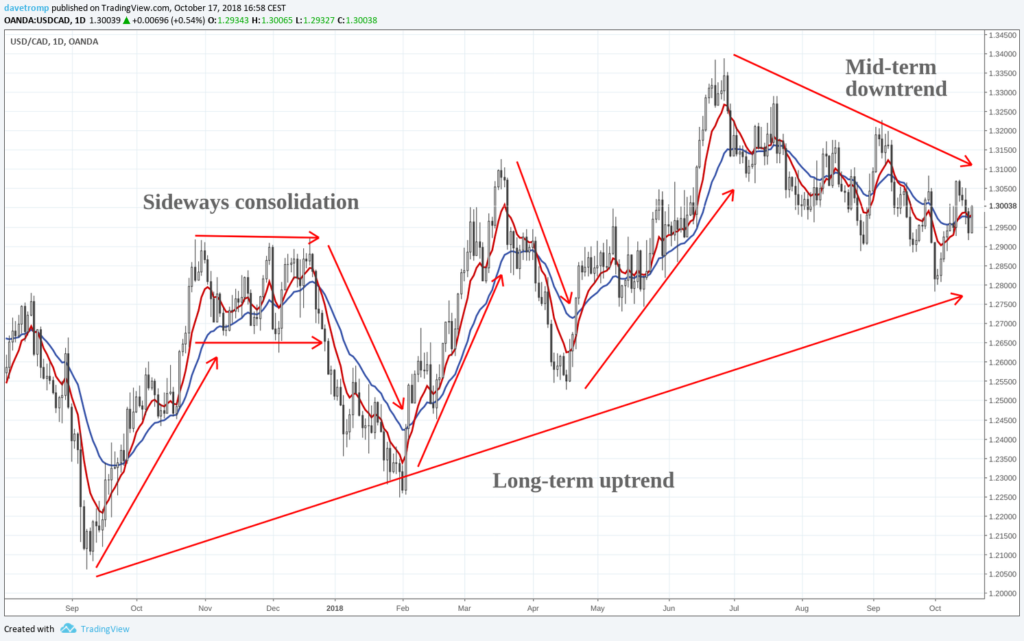
Trend
💡 Map out the Market structure!
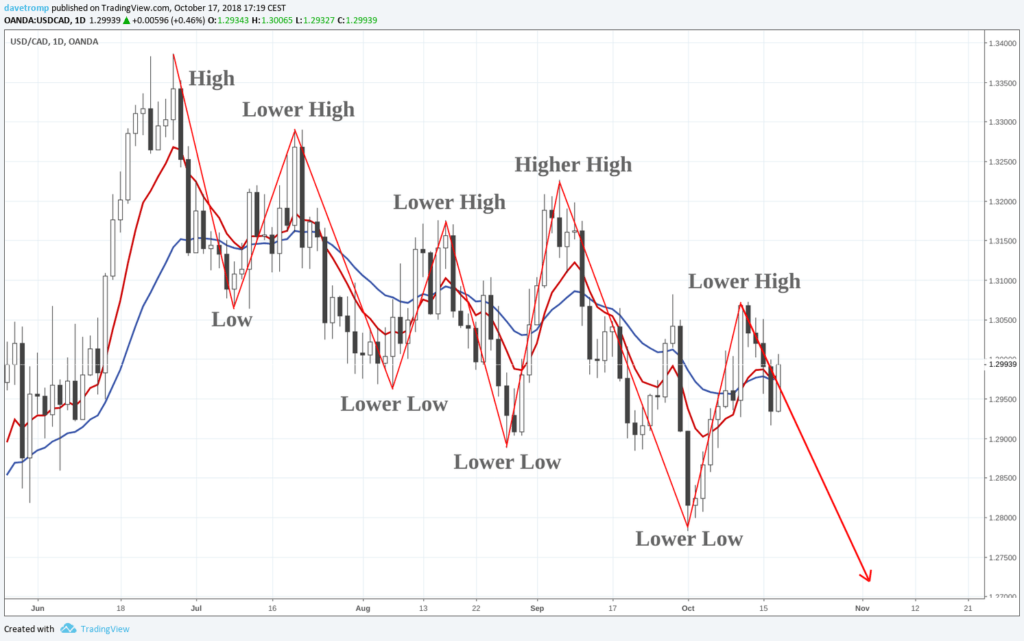
I will analyze Market Structure to understand how price reaches or moves away from Areas of Value. I will look at:
- Highs and lows
- Impulsive/corrective nature
- Chart patterns: 2-touches, 3-touches, flag, pennants, wedges, channels, double tops, head and shoulders etc.
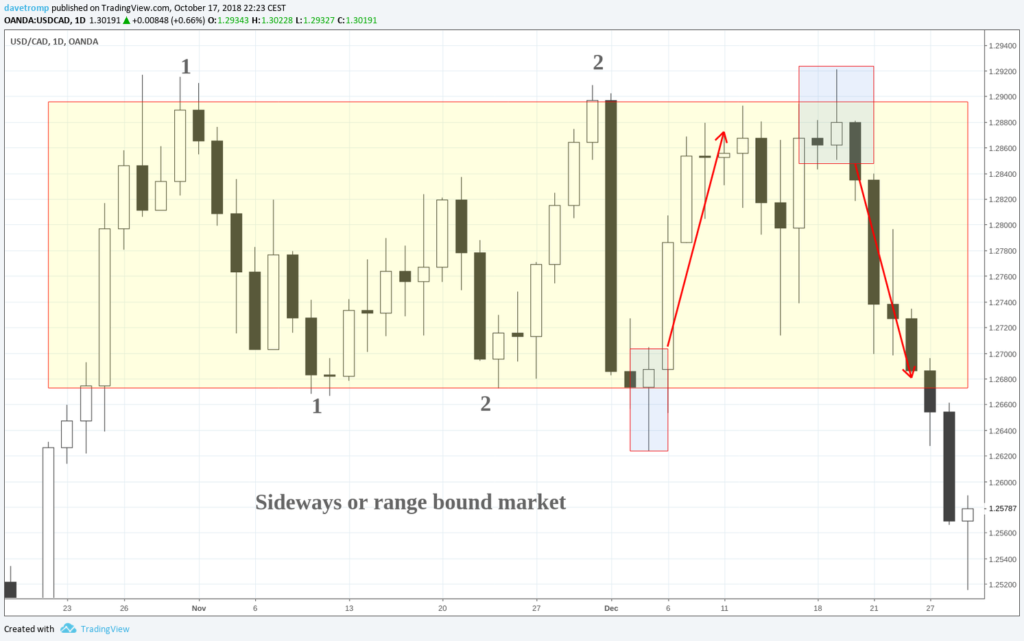
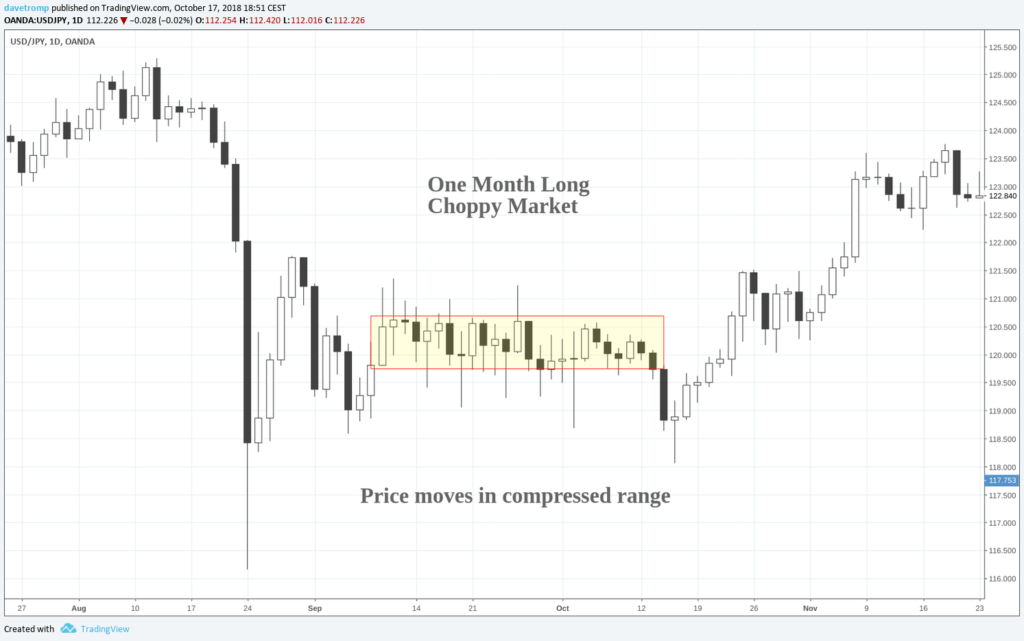
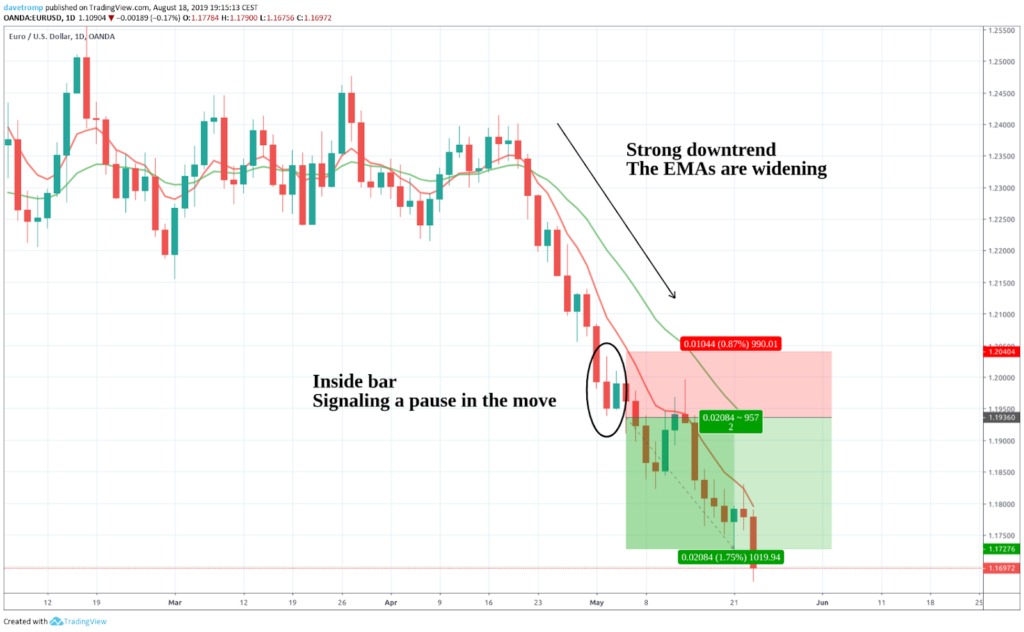
Look at weekly and daily TF to see if we have a strong move and in what direction, or that the market is ranging.
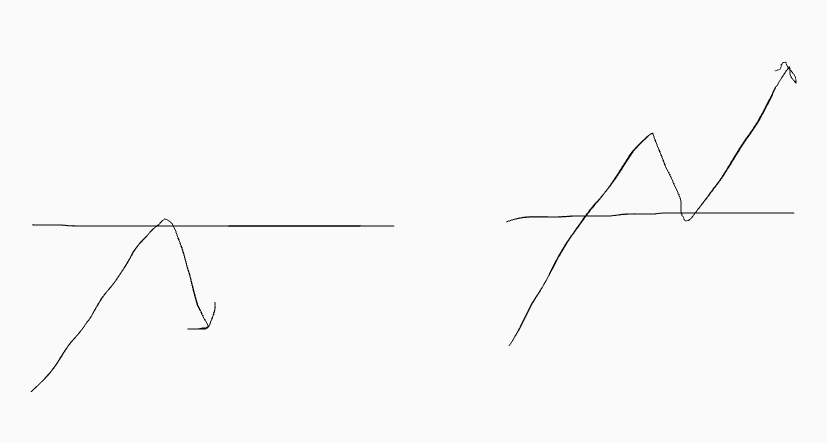
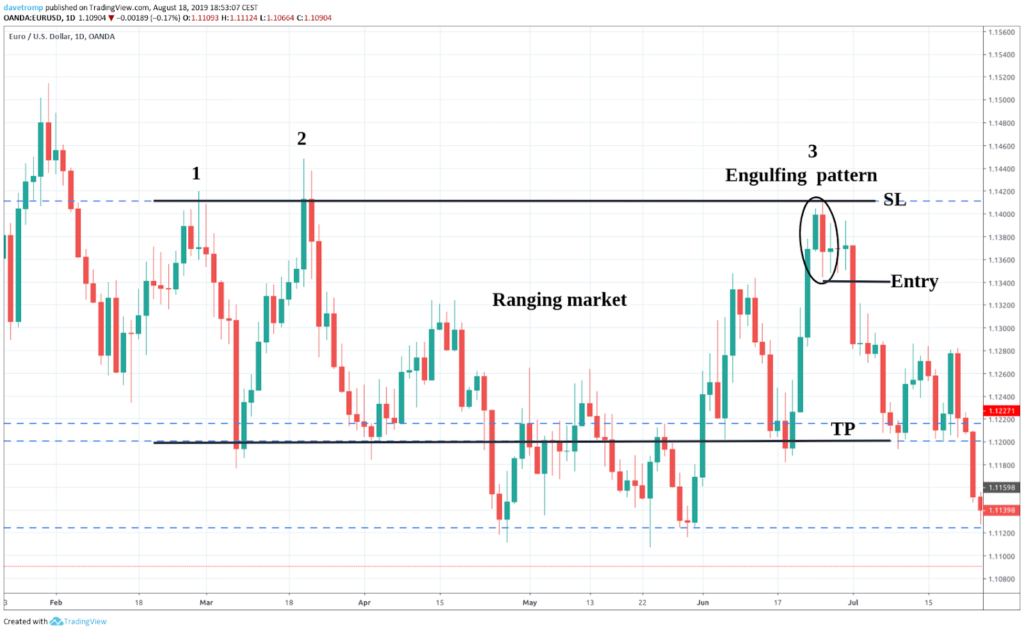
Reversal If I trade against the direction of the trend, then I look for an area of value to hold and price to bounce of that area AKA level.
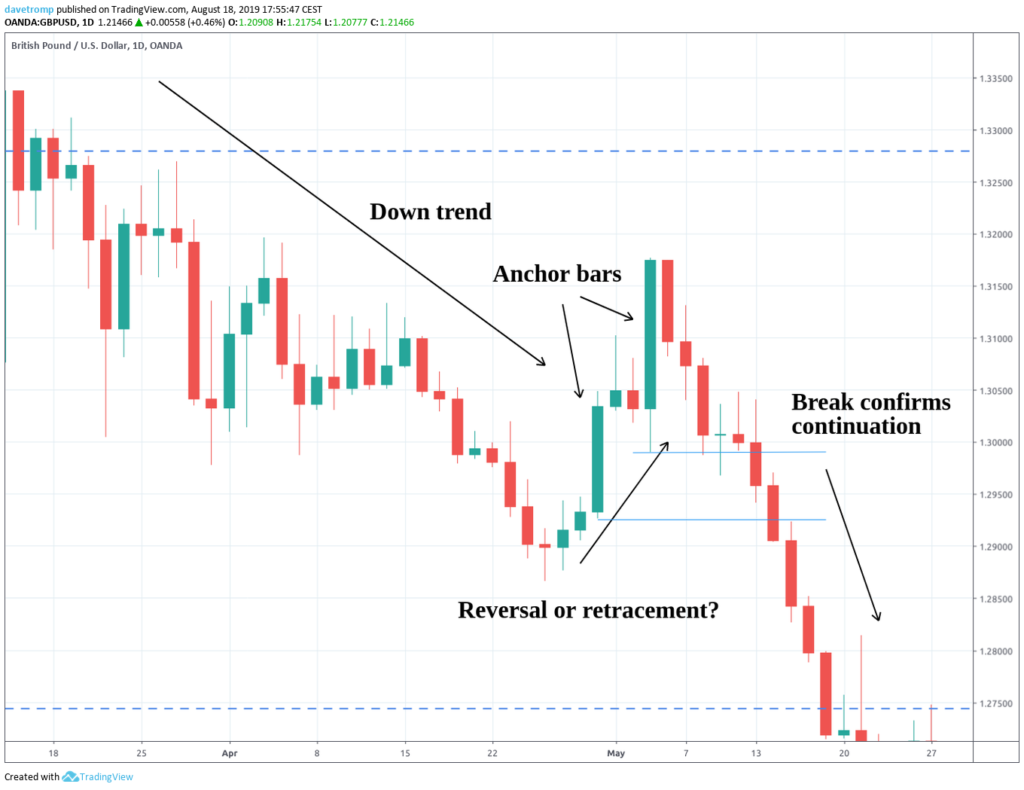
Continuation
If I trade in the direction of the trend, then I loop for price to break through an area of value, and then to retest that area.
Level
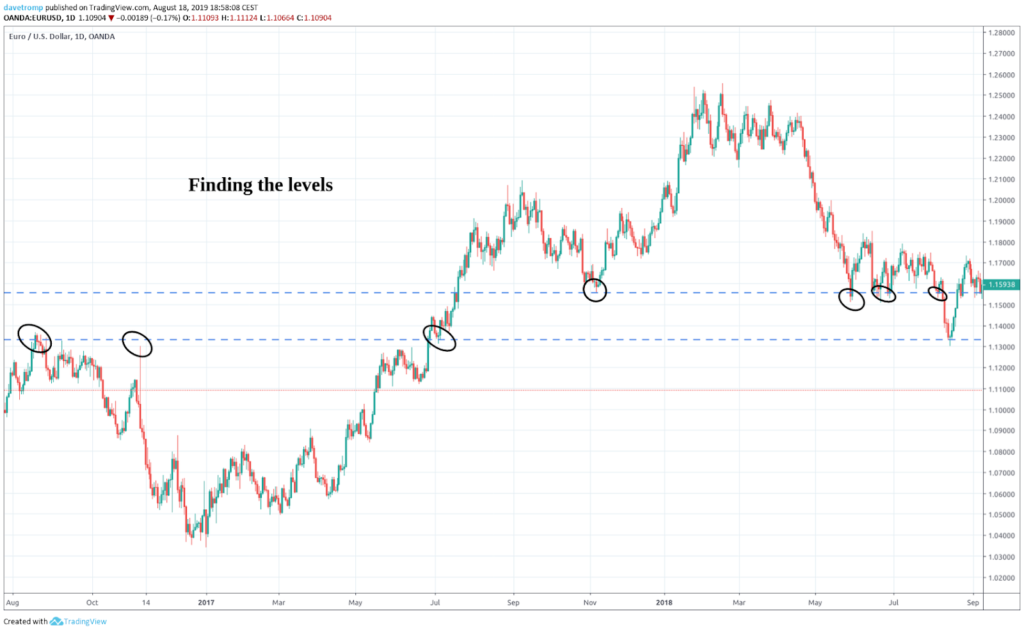
💡 Map out the Areas of value.
I will map out Areas of Value using:
- S&R Lines/Zones
- Supply and Demand Zones
- Trend lines (used as additional confluence)
- EMAs (used as additional confluence)
Only trade at an area of value. Use alerts to be notified of an approach.
Use market structure to judge the approach of a level and judge if the level is likely to either hold for a reversal or break for a retest and continuation. Can be seen more clearly usually on the H4.
Signal
💡 Enter at breaks of structure and/or based on candlestick patterns at areas of value.
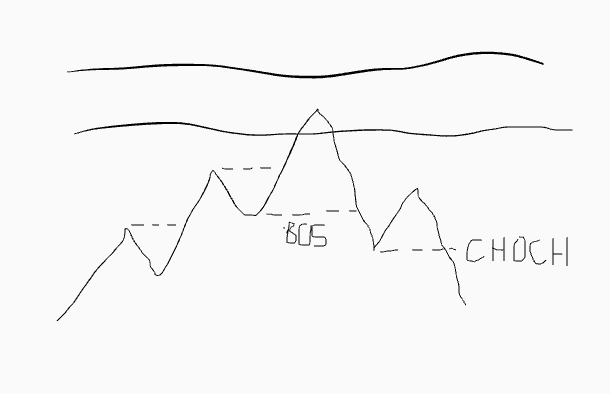
Break of Structure (BOS and CHOCH)
Breaks of structure at areas of value are:
- Breaks of previous highs or lows making lower lows or higher highs. For this I can also check the H4
- Trend line breaks (confluence)
- S&R lines/zone breaks (confluence)
- Supply and demand zone breaks (confluence)
- Chart patterns breaks (confluence)
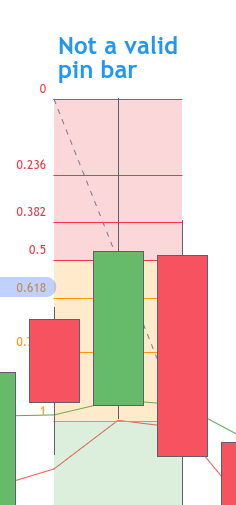
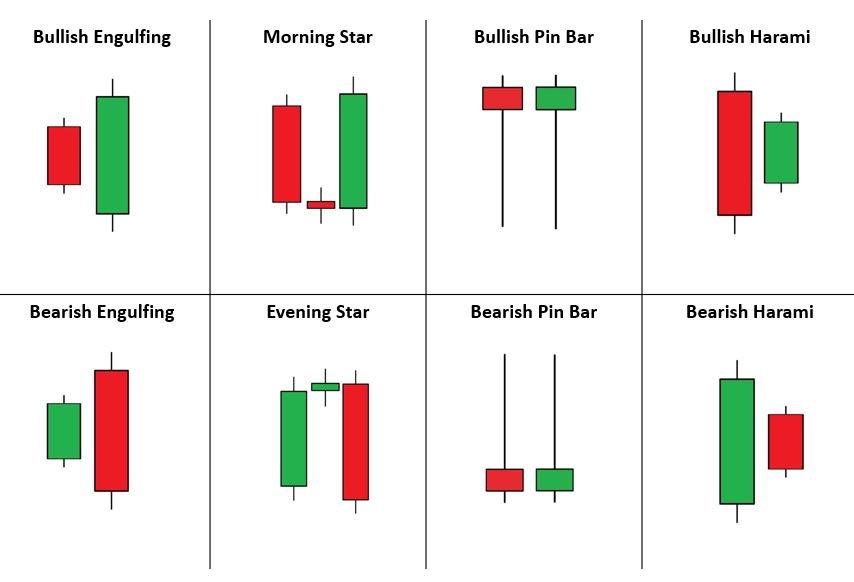
Candlestick Patterns
Candlestick patterns indicating a reversal or retest continuation at areas of value are:
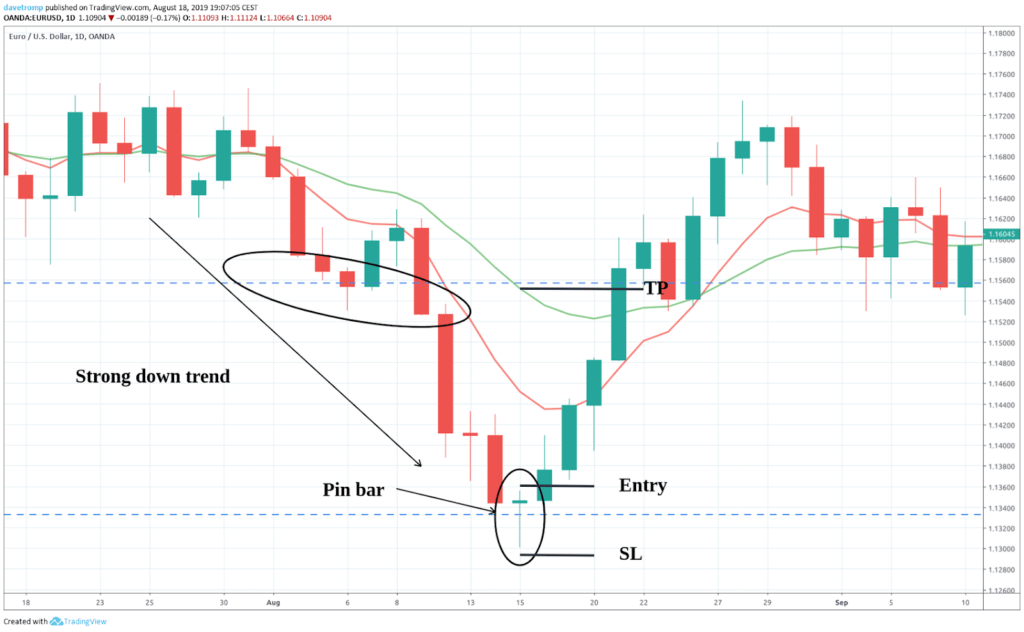
- Pin bars
- Engulfing bars
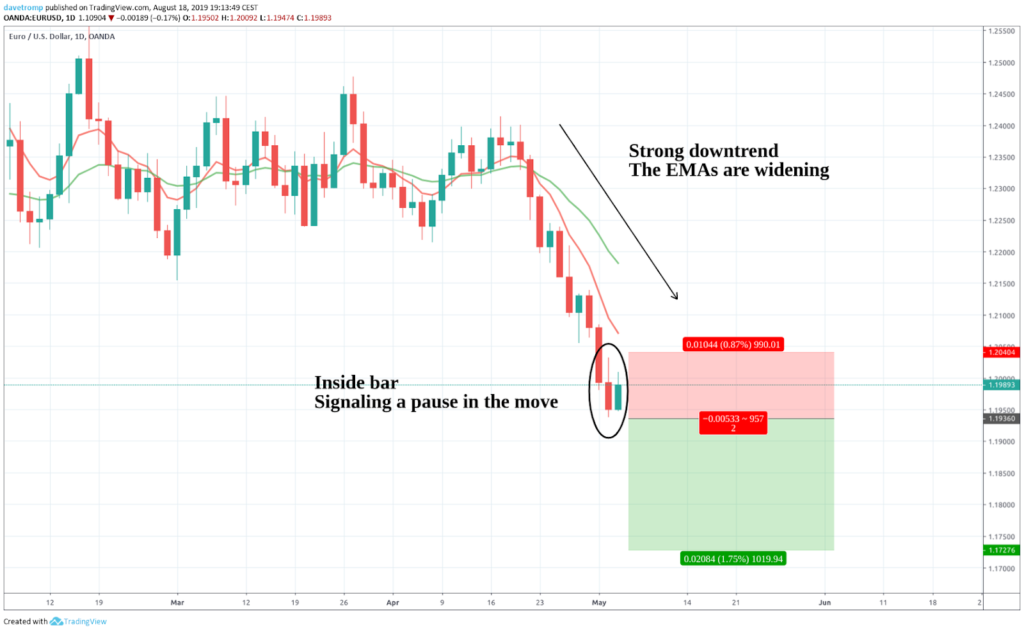
- Inside bars (Harami)
- Morning star
- Evening star
- Piercing bars (dark cloud cover / rising sun)
- Tweezer bars
- Inside bar fake-outs
Quality of the Setup
I will try and assess the quality of the setup by looking at confluences. Each of the following will score 1 point:
- Clear preceding trend
- Higher TF Area of Value (One or more TF higher than the entry TF, so W, or M)
- Entry TF Area of Value (Daily)
- Clear candlestick pattern on the D
- Clear break of structure on the H4
- Path to the target is clear / unobstructed
Only enter the trade if the setup scores 3 or more points and the minimal possible RR is 1:2.
Entries
💡 Enter at breaks or retraces of signal patterns!
Entry at Break
I enter using stop orders at the break of the high or low of the previous candle or candlestick pattern.
or …
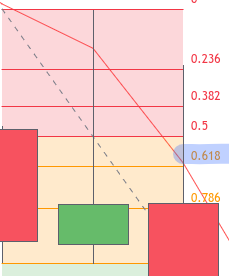
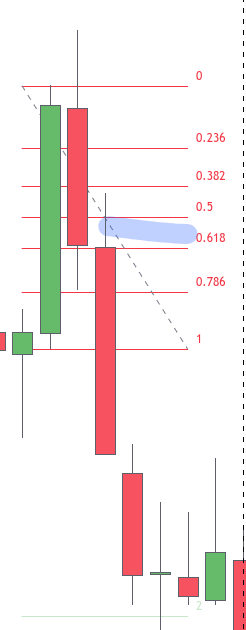
Entry at Retrace
I enter using limit orders entering at the 50% retrace level of the previous candle or candlestick pattern. This will give me a tighter stop and better risk to reward ratio on the trade.
As I am trading end of day I will mostly use candlestick patterns on the Daily TF as entry triggers. Lower time frames (mostly H4) will be used for fine-tuning the analysis of the market structure.
I will almost never enter at market.
Stops
💡 Get out where the trade hypothesis is invalidated!
I always place a stop-loss order. The order will be placed behind the area(s) of value, which can be:
- Supply and demand zones
- S&R levels
- Trend lines
- The other side of the chart pattern used as the entry.
- The other side of the entry candlestick pattern used as the entry.
Targets
💡 Get out where there is a high probability of the price going against me.
On most orders, I will place an initial take-profit order depending on the trade management of the order (see the trade management section). In general, I will place the take profit order before the next major area of value, which can be:
- Supply and demand zones
- S&R levels
- Trend lines
- Recent swing highs or lows
Trade management
💡 Do as little as possible, just monitor and stick to the rules.
Risk 1% per trade based on stop loss distance. Use the position sizer to calculate the correct lot size to trade.
I can enter multiple trades on the same pair at the same time.
I do set-and-forget trading.
I do not move my stop to break even.
I can scale in or out. And I can hedge.
I usually close all trades before the weekend. Only if the trade looks really strong will I leave it open over the weekend.
I will map out the market structure and additional areas of value as the trade unfolds. Based on this and based on candlestick patterns that may show up I could either close the trade before it hits the target or I might extend the target.
Risk Management
What is your account type and size (and any other relevant info)?
Offshore CFD broker account, 1:1000 leverage, minimum forex trade size 1000 units at SimpleFX because:
- they have reasonable spreads
- I only need to deposit a low amount to be able to trade as if I have a bigger account. The rest of my account balance I keep in my own bank account or crypto wallet.
- I can fund the account using USDC, USDC, BTC, LTC, etc.
- No KYC
- They offer negative balance protection.
What is your risk profile?
Low risk. I only take trade with 3 out of 6 confluences.
What is your risk per trade as a percentage?
1 % per trade or I will trade the smallest possible lot size if this means that the risk is still less than or equal to 2%.
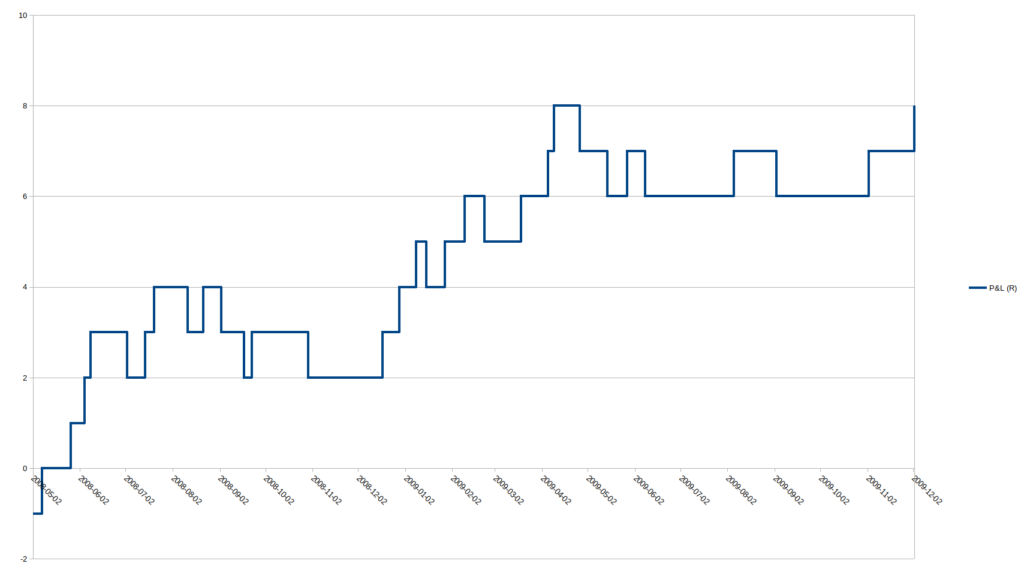
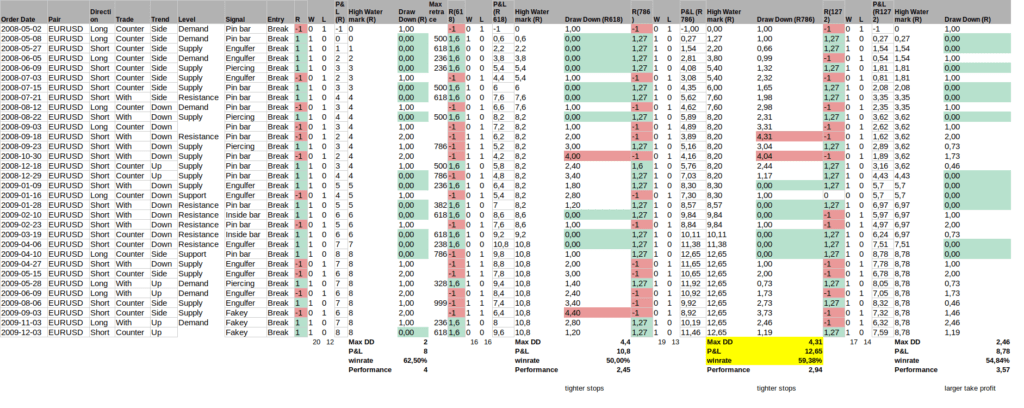
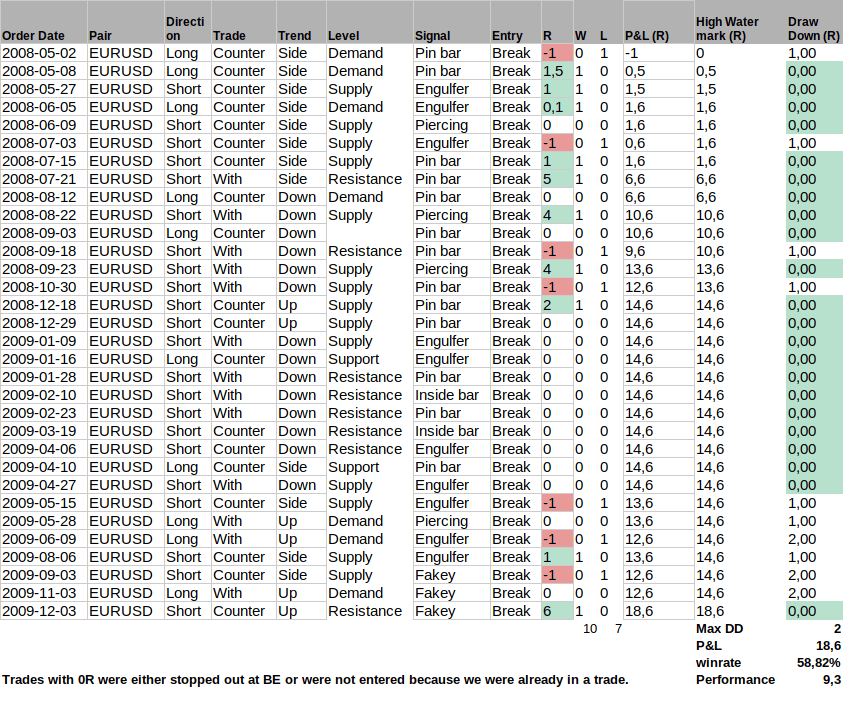
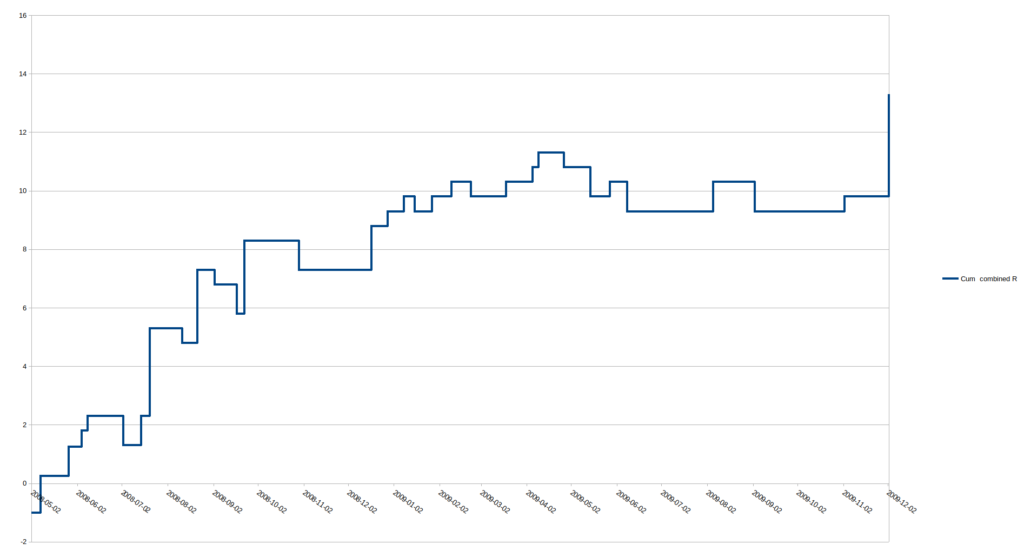
What is your maximum drawdown before you stop and reassess?
16%. Back test showed a 14R max drawdown for this tradingplan.
Will you have more than one trade open at a time?
Yes, I can addon to trades and also hedge trades.
If “yes” to the above, what is your maximum risk exposure at any one time?
6%