Home » Blog » Getting Started Trading »
Support and resistance trading is one of the basic building blocks of trading. Not only is it a basic building block of my trading, but also of most trading done by professional traders. So even if your trading system does not incorporate support and resistance it is still good to understand it and take notice of the most important price levels. Just because many traders are watching these levels, prices usually will react when they get there. Support and resistance are all about “Bulls and Bears”, aka “Buyers and Sellers” and how price itself affects their behaviors/decisions.
Table of Contents
- Self Fulfilling Prophecy
- Support
- Resistance
- Reactions to support and resistance levels
- How do support and resistance levels develop?
- Where are S&R levels found?
- How to draw support and resistance levels
- How to trade support and resistance
Self Fulfilling Prophecy
So what are support and resistance? Support and resistance are special price levels. These levels are not so much a precise price point, but more a price zone or area where price reacts in a certain (predictable) way. There can be several reasons why price reacts around these levels, but the most common reason is that everyone is expecting the price to react. So it is mostly a self-fulfilling prophecy.
Support
 |
| Support |
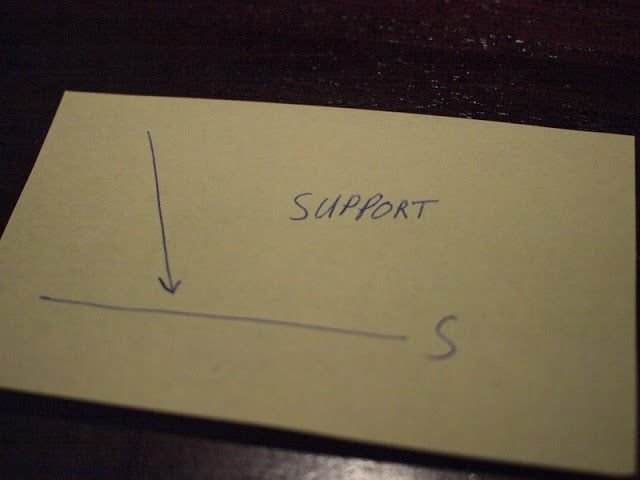
Support is where the price stops or stalls when moving down. Price is literary finding support in moving down. It is like there is a floor under the price. The price move will usually slow down while approaching the support level.
Resistance
 |
| Resistance |
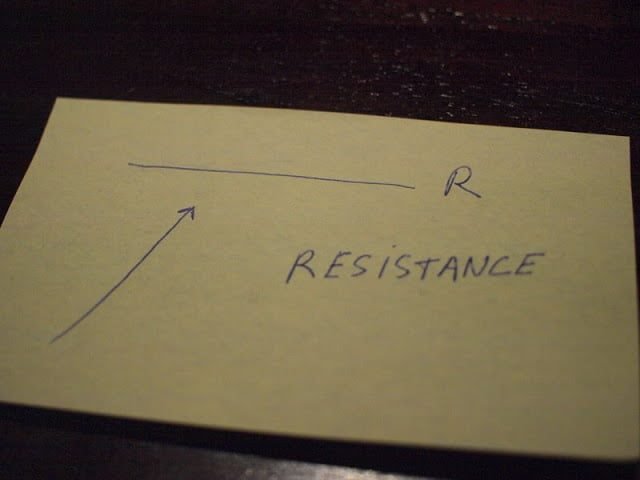
Resistance is where the price stops or stalls when moving up. Price is literary finding resistance in moving up. It is like there is a ceiling above the price. It does not mean the price will stop moving up, but the move may slow down approaching the level.
Reactions to support and resistance levels
The following price reactions can be seen at support and resistance levels:
- Reversals
Price movement direction can sharply reverse when the price is at a Support and Resistance area.
 |
| Reversal |
- Strong breaks
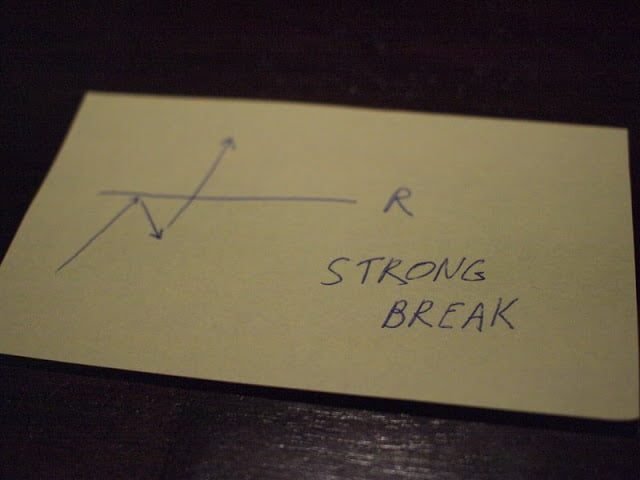
If the price crosses a Support level or a Resistance level it will usually only do so if there is a lot of momentum behind the move. This means the price will move quickly and within a short period while crossing the level. This can be driven by news or by big parties entering one side of the market.
 |
| Strong break |
- Consolidation
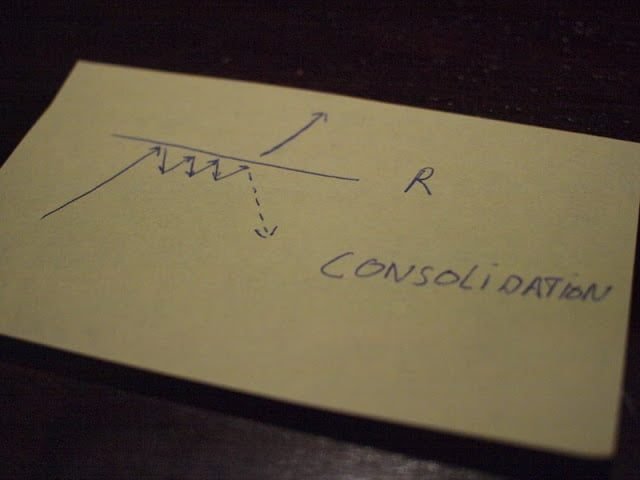
Price can stall and hang at or below a resistance level or on top of a support level.
 |
| Consolidation |
How do support and resistance levels develop?
To understand what processes are behind these levels of support and resistance it is necessary to go back to the fundamentals of the market. A market is nothing more than a (virtual) place where buyers buy stuff and sellers sell stuff at a price that is accepted by both parties. That seems obvious enough, but let’s look at how this works exactly and how prices come about because this will explain why Support and Resistance levels exist. Buyers and sellers will set prices where they are willing to buy or sell a certain amount of the asset. So if a lot of buyers are willing to buy at around the same price level, then this will show up as a level where prices stopped falling on the historical price charts. Most buyers will look at the historical prices to set their current desired buy-price levels even if they base their decision to buy on fundamental information for example. And by doing so they are actually creating a support level in the same area (again and again). Looking back at price charts you can often see price resting at the same support level over and over again. It also happens the other way around where many sellers are willing to sell at around the same price. A resistance level will form there as the price stops moving up at that level time and time again.
So there is something in the market that triggers the creation of an S&R level and then over time as more traders look at the historical prices to base their trading levels on, the S&R levels are being reinforced as they are respected by the market, buyers, and sellers, over time.
Where are S&R levels found?
Support and Resistance levels are found at:
- Round numbers
Round numbers are one of the obvious areas where we see price reactions. Round numbers are a psychologically significant level. For example, a EURUSD price break below 1.00 is in the minds of many people more important than a break below 1.01. There is no real reason why it is more important, but it is perceived as such because 1.00 is a more rounded number with more zeros at the end. And in this case, it is also a break below the parity of the Euro and the USD. So as a rule of thumb, when a price is more rounded it becomes more of an S&R level. - Reversals
As said, traders, buyers, and sellers look at historical price charts to see at what price a price move reversed. These are horizontal price levels.
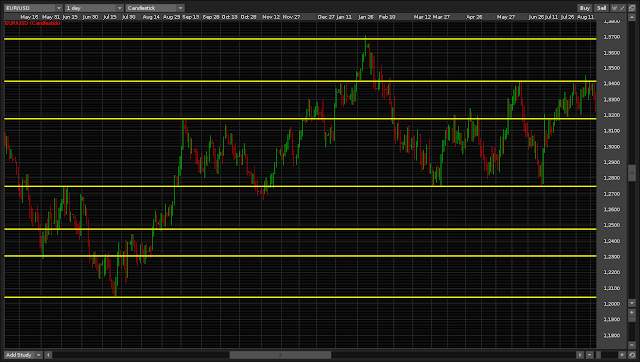 |
| Reversals create horizontal S&R Levels |
- Trend lines
Prices move up and down, but hardly ever in a straight line. We can often see prices move up and then retracing a bit and then moving up again. If we draw a trend line connecting all the lower swings, then we can see this trend line acting as a diagonal support line. If we duplicate the trend line and move the line on the chart we can find more points where the line seems to act as both support and resistance. Drawing trend lines is subjective, so the support and resistance will be less accurate than the horizontal S&R levels. Still, it can give you an indication of what other traders are looking at and tell you what they might do when the price gets there.
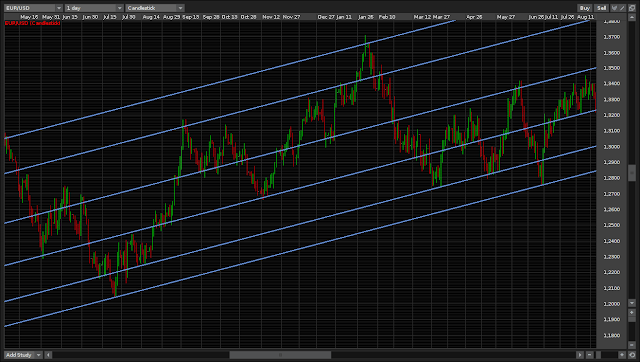 |
| Trend lines create diagonal S&R areas |
- Moving averages
There are a couple of moving averages that most traders look at before placing a trade. And just because everyone is looking at them they begin to act as dynamic support and resistance. These moving averages are:
– 20 ema
– 50 ema
– 200 sma
I will get into more detail about moving averages in a later article. In the below screenshot, you see the 50 ema acting as dynamic support and resistance several times.
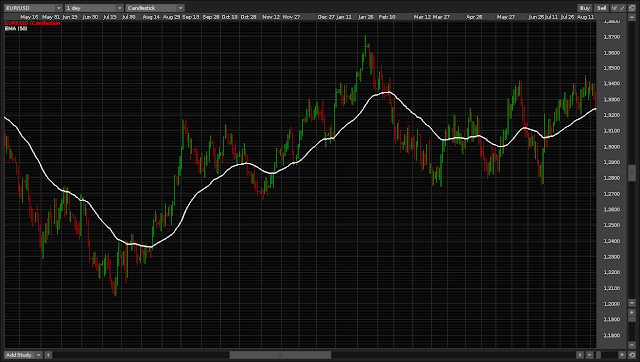 |
| Moving averages provide dynamic S&R |
How to draw support and resistance levels
S&R Levels are best drawn a few or at least one time frame higher than the time frame you are trading on. So if you are trading off of prices on the 4-hour time frame, then I suggest you draw your S&R levels of the daily time frame. Once you have the levels drawn in, you can drill down to your lower preferred time frame and fine-tune the levels.
If you find it difficult to see the levels on the charts, then it will help if you switch to a line chart. Just try it and you will see.
How to trade support and resistance
All that the S&R levels do is give you a framework from within which you can find trades. It is a look at the markets. It is certainly not the look at the market. Some traders trade only with S&R levels and are profitable in doing so.
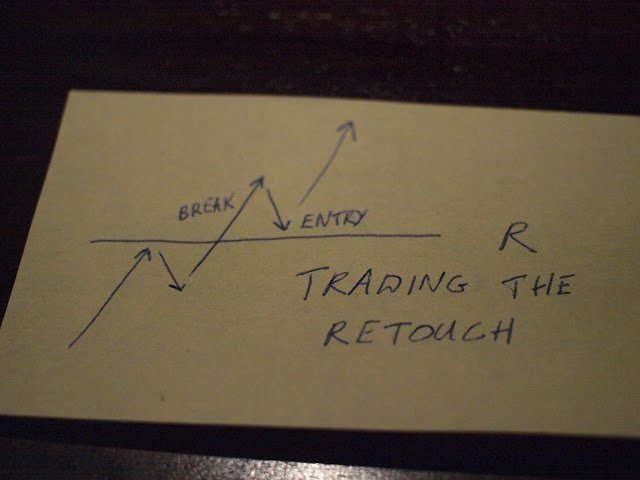 |
| Trading the retouch |
One way of trading an S&R level is to look for a break of the level and then wait for the price to retrace to the level and enter there in the direction of the initial break. The idea behind this entry is that most of the time former support becomes resistance and vice versa. Does this always work? No. But with proper money management, this can be a profitable way of trading.
Another way to trade S&R levels is to just enter in the opposite direction of the price move near or at a support or resistance as if you are expecting a reversal and get out of the trade if the price moves beyond the level. Again, if this will be a profitable way of trading depends on many other things like your money management en position sizing. This is something I will talk about in a later post.
All and all these are valid ways of finding entries and exits.
Support and resistance levels are part of my way of trading. They are not the only thing I look at. If you want to get an overview of how I trade, then you can check out my previous post.
In my next article, I will discuss another tool in my trading toolbox:
Japanese Candlesticks


Comments are closed.