Home » Blog » Getting Started Trading »
When you start trading for the first time, it is very tempting to take every trade that comes your way. It is much better, however, when you are just learning how to trade to only ever trade with the trend.
Table of Contents
- Why you should trade with the trend if you are a beginner
- What is a trend-following strategy?
- What does it mean to trade with the trend?
- Why you should not trade against the trend as a beginner
- How to identify the trend
- What indicators can be used to help you identify the trend
- How do you enter a trade with the trend?
- Do only beginners trade with the trend
Why you should trade with the trend if you are a beginner
Trading with the trend is much easier, than any other way of trading. It will give you a higher win ratio, so it will allow you to make some mistakes without losing your shirt doing it. Also, your potential take profit targets can be much larger trading with the trend and they are often hit more quickly as you are trading with momentum as well.
Trading with the trend is not the same as implementing a trend-following strategy. Let’s look at both what a trend-following strategy is and what trading with the trend is. This should clearly show you the difference between the two.
What is a trend-following strategy?
So what is a trend following trading strategy exactly? A trend-following trading strategy is a strategy that only trades in the direction of the prevailing trend. The strategy is designed to capture the meat of a price move. The characteristics of a trend-following trading strategy are:
- Entries and exits are typically somewhat late
- The win rate is low (20% or lower)
- There will be many small losing trades of short-duration
- But there will be a few big winning trades, that take a long time to play out and that make up for all the losses and more.
- There will be long periods of potentially big drawdowns.
A trend-following strategy can be very profitable. However, it is extremely difficult to implement.
What does it mean to trade with the trend?
Trading with the trend means trading shorter-term opportunities that can be traded in the same direction as the prevailing trend. The characteristics are:
- Winning and losing trades should not be open for more than a few candles.
- Average win rate between 40% and 60%
- The average R will be between 1 R to 3 R
- There will be drawbacks, but not anywhere near the level that will make your stomach hurt.
So as you can see these characteristics are very different from a trend-following strategy. And in my opinion, this way of trading is much easier to implement as a beginning trader, because there is no long period of losing trade after trade, which can be demotivating.
Why you should not trade against the trend as a beginner
So as a beginner, you should not try to implement a trend-following strategy, but trade with the trend, right? But why not trade against the trend? Trading against the trend is also known as fading the move. So let’s say the price is moving down and moving down. It is very tempting at this point, to say: hey, I am going to buy it cheaply now.
And this is what many beginning and losing traders do. Many regulated brokers (mine too) now have to disclose how many of their clients are profitable and how many are not. There are differences between brokers, but on average, between 70 and 80% of all traders lose money. And guess how they trade?
Most losing traders mainly trade counter-trend.
How do I know this?
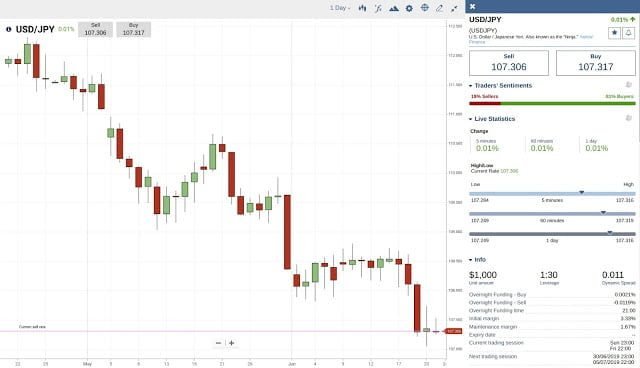
Well, whenever I see a clear and strong trend, I check the trader’s sentiment tools that most brokers offer. And almost always the majority of traders is trading against the trend. So knowing this and knowing that most traders lose money, makes me conclude that most traders lose money while trading against the trend. Just look at the screenshot of one of my broker’s platforms. Trader’s Sentiment indicates 81% Buyers.
So, the trend is your friend, is the old trader’s saying. And by now I hope you understand that there is truth in it.
How to identify the trend
There are two trends we can recognize:
- An uptrend
- And a downtrend
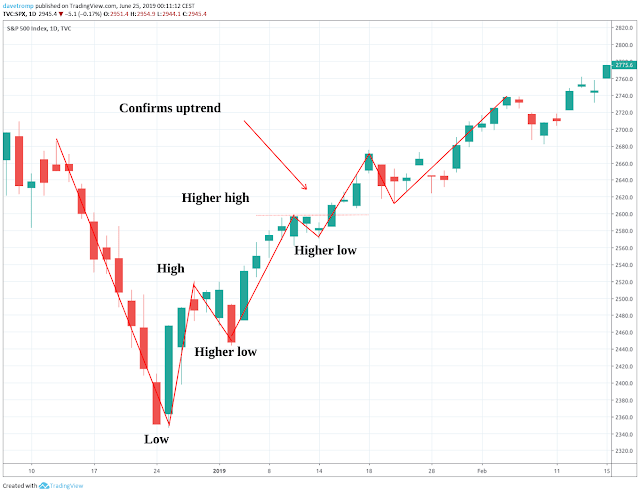
An uptrend is confirmed once the price has made a higher low and a higher high.
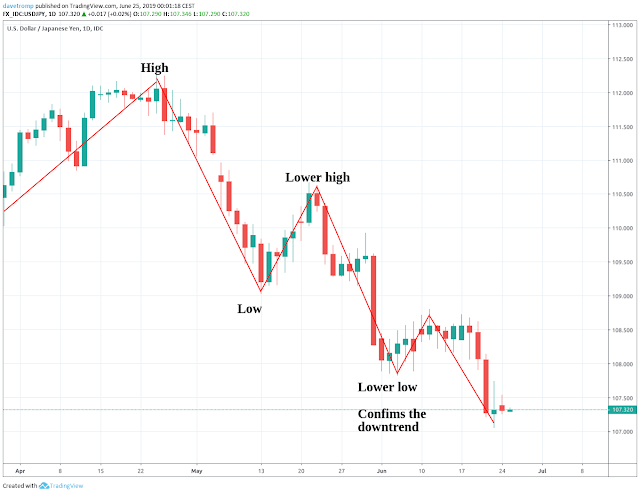
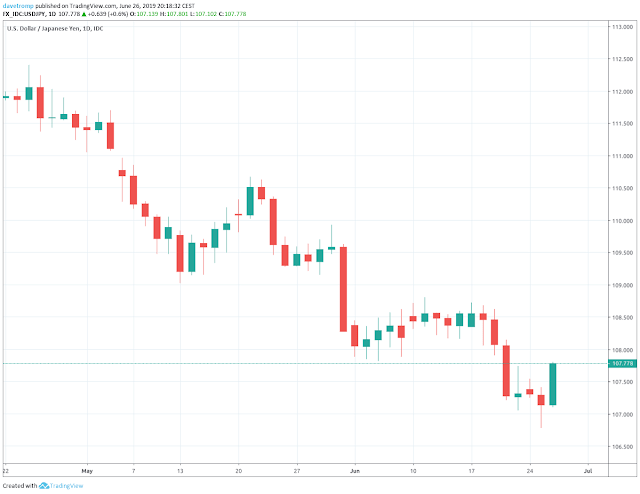
A downtrend is confirmed once the price has made a lower high and a lower low.
Here are some examples that will visualize what this means.
Uptrend
Downtrend
What indicators can be used to help you identify the trend
Looking for the highs and lows in price swings to identify the trend can be daunting at times. It is not always as clear-cut as I showed you in the above examples. Luckily many indicators can help you identify the trend. I will briefly explain a few of them.
Here are the three indicators that I use myself:
- Moving Averages
- Ichimoku
- Candlesticks
Here are two commonly used indicators for identifying the trend:
- Bollinger band
- RSI
And here is a more exotic one:
- Heikin Ashi
Let’s dive in, shall we?
Moving Averages
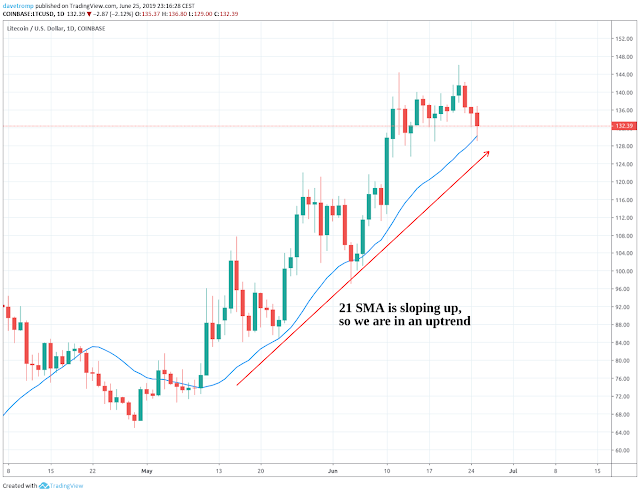
There are two ways that I use moving averages to help me identify the direction of the trend.
The first one is to just look at the slope of a single moving average. I use the 21 Simple Moving Average (SMA).
If the slope is pointing up, then we are in an uptrend.
If it is pointing down, then we are in a downtrend.
If it is flattening/leveling off, then the trend is unclear.
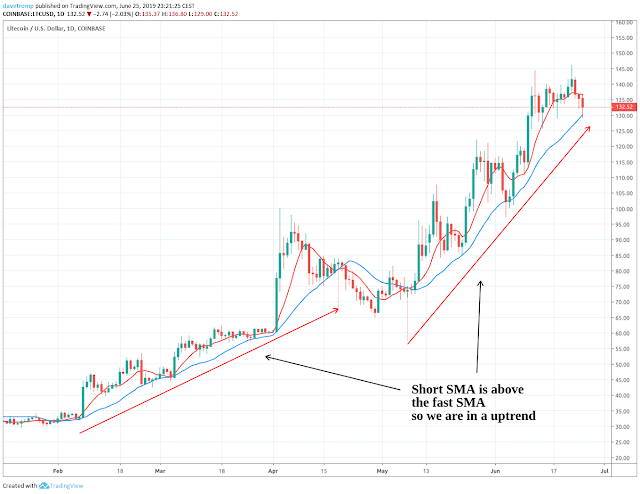
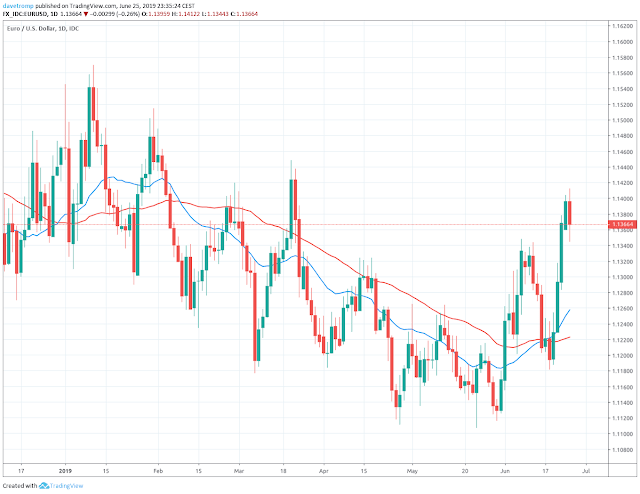
The second one is to look at a slow and a fast-moving average.
If the fast-moving average is above the slow one, then the trend is up.
If the fast-moving average is below the slow one, then the trend is down.
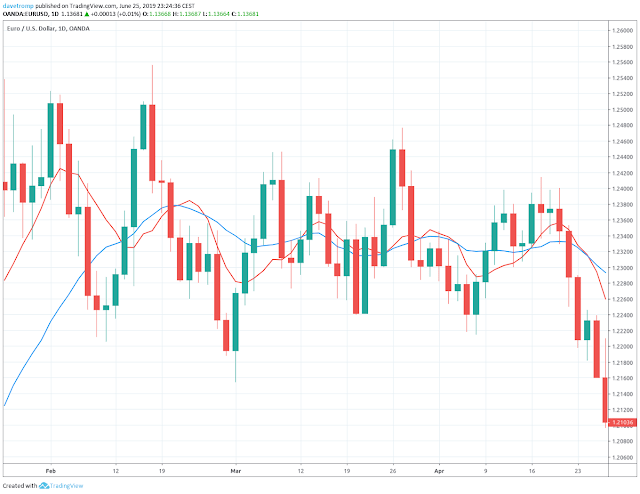
If the fast and the slow-moving average are constantly crossing each other, then we are in a sideways or choppy market.
I prefer to use the 8 SMA as the fast-moving average and the 21 SMA as the slow-moving average.
The above examples were perfect, so I could clearly illustrate the point. Now here is an example of a sideways market. As you can see the SMAs keep crossing each other and the 21 SMA is more or less flat. Also, the SMAs become compressed and move very close to each other.
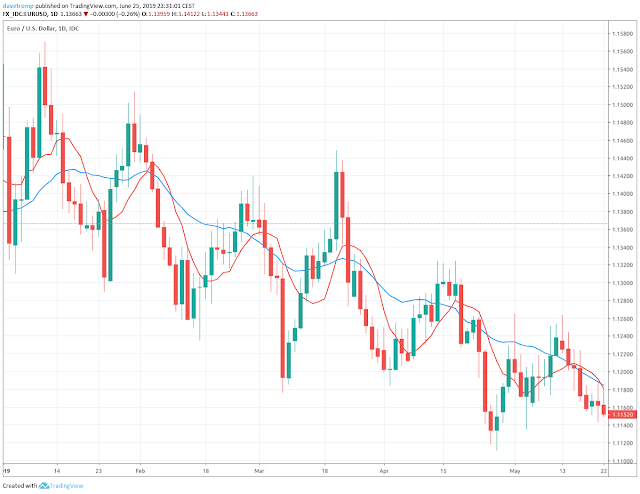
Slow Grind
Sometimes a market can be trending, but do it slowly. I call this a slow Grind. It looks like on the below chart.
The fast SMA, as well as the price itself, is turning around the slow SMA. The slow SMA is pointing down so this could tell us the predominant trend is down. If I see this I sometimes change the 8 SMA to a 50 SMA. This now makes the 21 SMA the fast-moving average and the 50 SMA the slow one. Then normally everything becomes clearer again. See the below chart for an example with the 21 and the 50 SMA.
All that moving averages do, is, reduce the noise in the price movements. They let you focus on the bigger picture.
Ichimoku Kinko Hyo
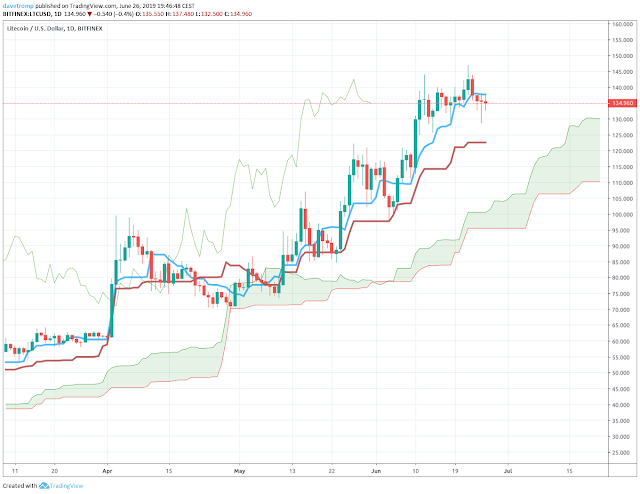
The Ichimoku Kinko Hyo is also known as the Ichimoku Cloud indicator. It is a complete trading system in itself and is designed to help a trader see what condition the market is in just one glance. Here is a very clear example again on Litecoin.
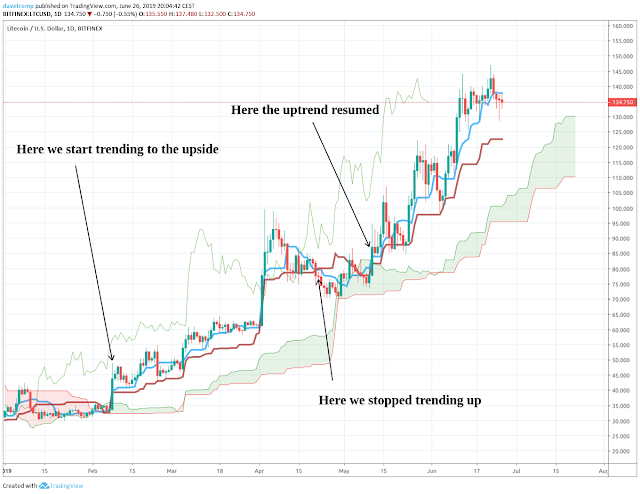
I use the following basic rules to make sure I trade with the trend:
- If the price is above the Cloud, that light green filled area that looks like a cloud, I only look for long trades if I want to trade with the trend.
- If the price is below the Cloud, then I only look for short with trend trades.
- If the price is in the cloud, then I do not trade the trend at all.
- For long trades, I also want to see the blue line (Tenkan) above the red line (Kijun)
- For short trades, it must be the other way around.
- And the last thing I look for is the thin green line. I need it to be above the price for long trades
- and below the price for short trades.
Here you can see these rules in action:
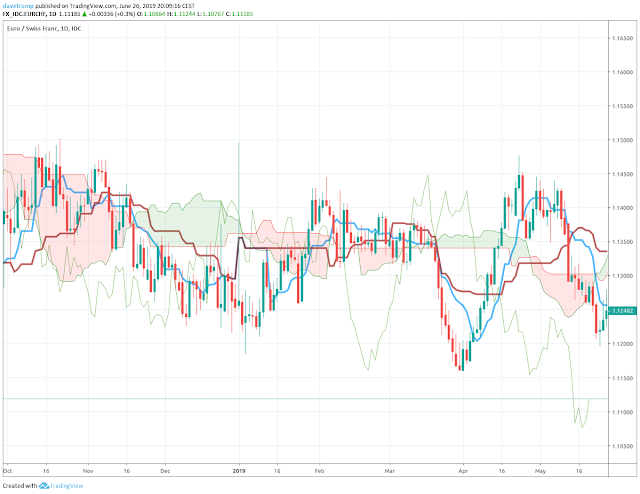
And now this is what the chart will look like if the markets are not in a trend:
What a mess!
But that is exactly the point. We see a mess, we don’t trade.
Candlesticks
This is a simple one, but it does take some practice to read the charts right this way. I always use candlestick charts, the type of charts you see on this post right now. Bullish candles are colored green and bearish candles are colored red. Now another basic rule I use to determine the trend is:
I ask myself the question: are there more red candles or more green candles on the chart?
If there are more red candles, then we must be trending down.
If there are more green candles, then we must be trending up.
It is not only a question of the count of the red against the green candles, but also the average size of the candles is important.
If the green candles are on average larger than the red ones, then this indicates an uptrend.
If the red candles are on average larger than the green ones, then this indicates a downtrend.
Bollinger bands
I do not use this method for trading with the trend, but I will explain it so you can test it yourself. Maybe it suits you and will help you to trade more successfully. The Bollinger Band indicator is a simple moving average plotted above and below the same line but at a plus or minus standard deviation of the average. So that is a whole lot of statistics in one line. You do not need to know this, although it helps with understanding what the indicator is telling. The most important takeaway is that when prices are moving up, they tend to hug the upper band and when they are moving down they tend to hug the lower band.
Now, if we plot two Bollinger band indicators on the chart with different standard deviations, we get the image below. The tighter band is at 1 standard deviation while the wider band is at 2.
Notice how the price is between the 1 and 2 standard deviations when it is trending. We can best buy and sell at the tighter band while the price is trending. If the price is in the light blue area, then it is in “No Man’s Land” and we do not trade.
RSI
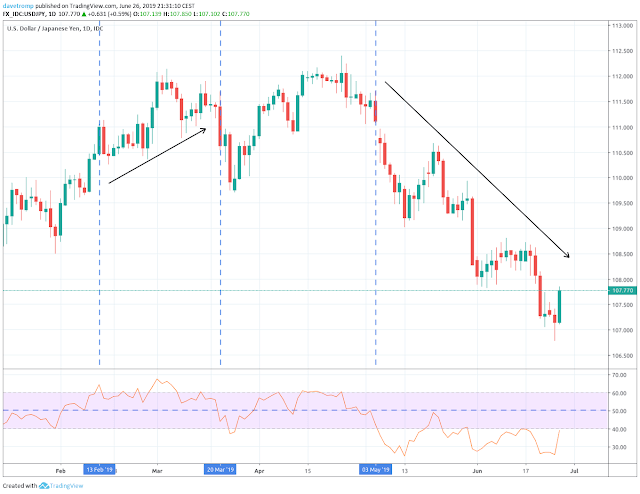
Most traders know the RSI indicator as an indicator that shows when the price is overbought or oversold. And yes the RSI can be used for this, but it can also be used to spot the trend. Overbought and oversold are mostly spotted by setting the boundaries at levels 20 for oversold and 80 for overbought. These indicate extreme “relative” high or low price levels. However, the definition of a trend is that price makes higher highs or lower lows. This means that an above-average RSI level could be somewhat of an indication of a trend.
So, on the below chart, there is an example of how you could set up your chart to find the trend. The levels are set to 40 and 60 forming the purple band. The blue dashed line is the center (50) line. A trend is formed when the RSI moves outside of the purple band. And the trend remains in place as long as the RSI remains above the centerline.
Note, that this is one way of using the RSI. You should test and tweak the settings to find what works for you.
Heikin Ashi
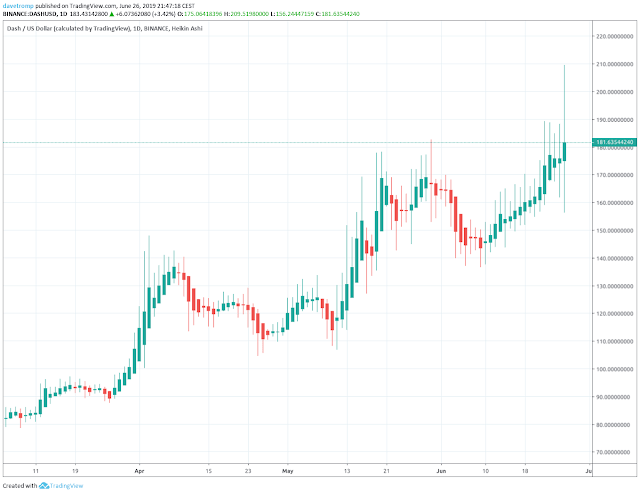
The Heikin Ashi indicator is not just an indicator, but it is a chart type at the same time. Simply put, the Heikin Ashi candle is a candle based on average prices. This smooths out the prices and gives a more clear picture of the prevailing trend. It is a bit exotic, but it is certainly worth exploring.
How do you enter a trade with the trend?
There are many ways to enter a trade but in principle, there are three ways to get in:
- Buy or sell at market
- Get in as the price retraces to a more favorable level
- Get in as the price breaks out
Market
You get in at market when all your signals are already green. This can be when you have an end of day based trading system and just as the market is about to close, you need to be in, so you will not risk the overnight gap. There can be other reasons. It all depends on your trading system.
Retrace
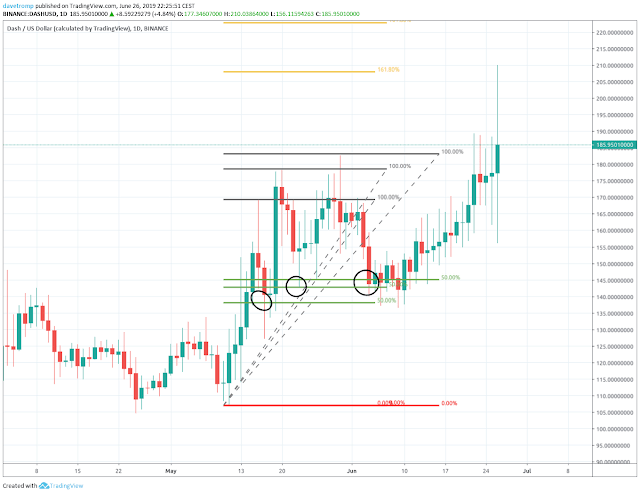
Sometimes it is better to wait for the price to come back to a lower level to buy more cheaply. If the price takes off, you will miss the trade, however. Here is a trick of how I get into trades at better prices. I use the 50% retrace of the current swing, which I measure with the Fib retracement tool. I keep moving my entry order up as prices move up in an uptrend. This can give multiple trade opportunities. See the chart below for an example.
Breakout
We could have found more or less the same entries using a breakout as a signal for entering. There are two ways to trade a break out:
- Enter when the price breaks a certain level
- Enter when the price retests the level it just has broken out of
Using the second entry method limits the number of false breakouts that you will enter into.
To figure out where to place your stop loss and take profit I suggest you read two posts that I specifically dedicated to this:
Do only beginners trade with the trend
It takes a lot of practice to trade successfully against the trend or to trade in a range-bound market. Many seasoned traders prefer to still trade only with the trend. It is a matter of personal preference and also a matter of figuring out what makes the most profit for you.
If you keep a trading log, as I do, then you can start to analyze what kind of trades make you profitable and what kind make you less profitable. So if you notice that all the counter-trend trades you made, made you lose money in the long run, then maybe you should just focus on trading with the trend.
So, if you are a beginning trader, you should focus on trading only with the trend. This does however not mean that trading with the trend is something only beginners do. Trading with the trend is, in my opinion, a viable way to trade for all experience levels. So don’t think you have to be fancy with your trading. In the end, all that counts is if you are profitable or not.


